CRUDE OIL
October 16, 2026
Risk Disclaimer: The example below is for illustrative purposes only and is based on price movements derived from Contracts for Difference (CFDs). The calculations reflect hypothetical outcomes using historical or specified price data for the relevant instrument on the stated date and are not indicative of future performance. Any reliance placed on this material is strictly at the user’s own risk.
Weekly Special Report: CRUDE OIL
TECHNICAL ANALYSIS:
- RESISTANCE AREA: $100 - $104. Since the Middle East war began on February 28, 2026, crude oil has reached or exceeded the $100 level 11 times, including its latest test. Historically, prices have stayed above $100 for an average of 2.6 days before retreating below this threshold. However, this does not imply the same outcome will follow.
LAST TIME: Crude oil moved above $100 on September 15, remaining above this level for less than two days before retreating below it.
- SUPPORT AREA: $90 - $85. Following previous tests of the $100 level or higher, crude oil has subsequently retreated to an average level of around $87 or lower.
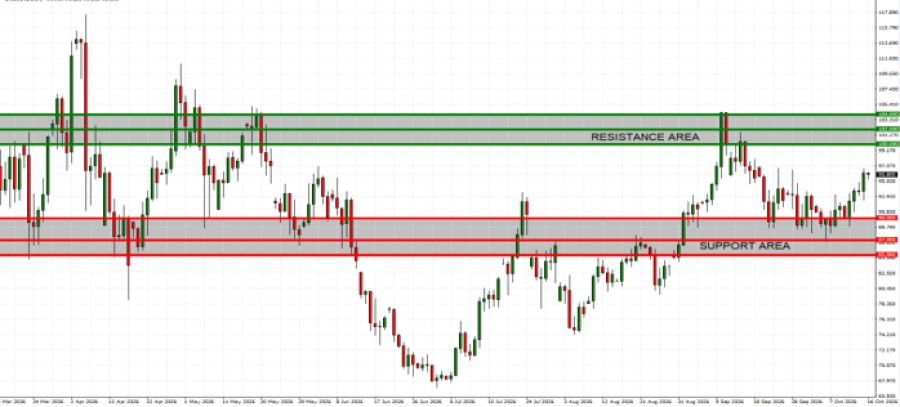
GRAPH (Daily): March 2026 – October 2026
Data Source: Meta Trader 4 Platform
Please note that past performance does not guarantee future results
Crude Oil, October 16, 2026
Current Price: 95.90
|
Crude Oil |
Weekly |
|
104 |
|
|
102 |
|
|
100 |
|
|
90 |
|
|
87 |
|
|
85 |
DOWNTREND
- U.S.–RUSSIA DIESEL AGREEMENT AND SANCTIONS RELIEF: On October 9, the U.S. temporarily eased restrictions on Russian diesel imports until April 7, 2027. Announced shipments total approximately 13.5 million barrels across the initial and subsequent deliveries.
- G7 STRATEGIC RESERVE RELEASES: The G7 agreed to release 100 million barrels of crude oil and diesel from emergency reserves to help offset supply disruptions.
- SAUDI ARABIA'S OIL EXPORT ROUTE RESTORED: The East-West pipeline provides an alternative route to the Red Sea, bypassing the Strait of Hormuz and helping maintain crude oil exports.
- MIDDLE EAST OIL EXPORTS RECOVER: Regional exports have rebounded to approximately 16–19 million barrels per day, approaching the pre-war level of around 20 million barrels per day.
- DIPLOMATIC EFFORTS: Pakistan and Qatar continue efforts to facilitate negotiations between the United States and Iran, potentially easing supply concerns if successful.
- U.S. MIDTERM ELECTIONS (NOVEMBER 3, 2026): High fuel prices could increase pressure on the U.S. administration to pursue diplomacy and reduce disruptions to global oil supplies.
Sources: Reuters, CNBC, Bloomberg, OILPRICE.COM, Fox News
Example of calculation based on weekly market trend for 1.00 Lot1
|
CRUDE OIL |
||||||
|
Pivot Points |
||||||
|
Profit or loss in $ |
-8,100 |
-6,100 |
-4,100 |
5,900 |
8,900 |
10,900 |
|
Profit or loss in €2 |
-7,194 |
-5,418 |
-3,642 |
5,240 |
7,905 |
9,681 |
|
Profit or loss in £2 |
-6,073 |
-4,574 |
-3,074 |
4,424 |
6,673 |
8,173 |
|
Profit or loss in C$2 |
-11,463 |
-8,633 |
-5,802 |
8,350 |
12,595 |
15,426 |
- The above calculations are made based on 1.00 lot which is equivalent of 1000 units
- Calculations for exchange rate used as of 11:00 (GMT+1) 16/10/2026
You can use risk management tools such as Stop-Loss and Take-Profit
UPTREND
- YEMENI HOUTHIS–SAUDI ARABIA TENSIONS: Intensifying hostilities between the Yemeni Houthis and Saudi Arabia could increase regional instability and put further upward pressure on crude oil prices.
- STRAIT OF HORMUZ AND BAB EL-MANDEB RISKS: Ongoing security concerns around the Strait of Hormuz and the Bab el-Mandeb Strait could threaten shipping routes and oil flows, supporting higher prices.
- U.S.–IRAN CONFLICT: Continued military confrontations between the United States and Iran, including attacks involving oil tankers, could heighten supply concerns and sustain upward pressure on crude oil prices.
Sources: Reuters, CNBC, Bloomberg, OILPRICE.COM, Fox News
Example of calculation based on weekly market trend for 1.00 Lot1
|
CRUDE OIL |
||||||
|
Pivot Points |
||||||
|
Profit or loss in $ |
8,100 |
6,100 |
4,100 |
-5,900 |
-8,900 |
-10,900 |
|
Profit or loss in €2 |
7,194 |
5,418 |
3,642 |
-5,240 |
-7,905 |
-9,681 |
|
Profit or loss in £2 |
6,073 |
4,574 |
3,074 |
-4,424 |
-6,673 |
-8,173 |
|
Profit or loss in C$2 |
11,463 |
8,633 |
5,802 |
-8,350 |
-12,595 |
-15,426 |
- The above calculations are made based on 1.00 lot which is equivalent of 1000 units
- Calculations for exchange rate used as of 11:00 (GMT+1) 16/10/2026
You can use risk management tools such as Stop-Loss and Take-Profit


