PALLADIUM
September 28, 2026
Risk Disclaimer: The example below is for illustrative purposes only and is based on price movements derived from Contracts for Difference (CFDs). The calculations reflect hypothetical outcomes using historical or specified price data for the relevant instrument on the stated date and are not indicative of future performance. Any reliance placed on this material is strictly at the user’s own risk.
Weekly Special Report: Palladium
PALLADIUM USE AND MARKET SHARE:
- Palladium is mainly used in catalytic converters for petrol and hybrid vehicles, where it helps reduce harmful emissions. Automotive demand is expected to remain the main source of palladium demand in 2026, accounting for more than 80% of total demand.
- MARKET SHARE (PRODUCERS): Russia remains the largest source of global palladium supply, accounting for around 44% of global mined production. South Africa is the second-largest producer with around 37%, while Canada is third with around 8%. Zimbabwe is the fourth-largest producer, with a slightly lower than 8% market share.
PALLADIUM: SUPPLY SIDE REMAINS RESTRICTED
- SUPPLY REMAINS UNDER PRESSURE: Russia remains a key source of global palladium supply, with Nornickel accounting for around 40% of worldwide production. Geopolitical tensions and sanctions-related restrictions on trade and logistics continue to create risks for Russian palladium supply. Nornickel expects its palladium production to fall to around 2.4–2.5 million ounces in 2026, a roughly 20-year low.
PALLADIUM: U.S. SHIFT TOWARDS GASOLINE SUPPORT DEMAND
- U.S. CAR PRODUCERS SUCH AS FORD, GM AND STELLANTIS ARE SHIFTING MORE PRODUCTION BACK TOWARDS GASOLINE AND HYBRID VEHICLES AS EV DEMAND WEAKENS. U.S. EV sales fell 21% year-on-year, while hybrids accounted for 19% of retail vehicle sales in August 2026. Gasoline and hybrid vehicles use catalytic converters, which could support automotive palladium demand in the U.S.
EVENTS:
- WEDNESDAY, SEPTEMBER 30 AT 02:30 GMT+1: CHINA MANUFACTURING PMI (SEPTEMBER). The Manufacturing PMI (Purchasing Managers’ Index) increased in August from 49.2 to 49.8, above the expected 49.5.
- FRIDAY, OCTOBER 2 AT 13:30 GMT+1: U.S. NONFARM PAYROLLS (NFP) AND UNEMPLOYMENT RATE (SEPTEMBER). A weaker-than-expected report could reduce expectations for another Fed interest rate hike, weighing on the U.S. dollar and supporting palladium prices.
TECHNICAL ANALYSIS:
- SUPPORT AREA: $1,200 - $1,100. After recently falling, Palladium is back near its strongest support area between $1,200 and $1,100. Palladium has tested this region on five occasions over the past year, repeatedly rebounding from these levels. Following these tests, Palladium has rebounded to an average high of approximately $1,425, with an average price increase of around $267. Although the price could also fall.
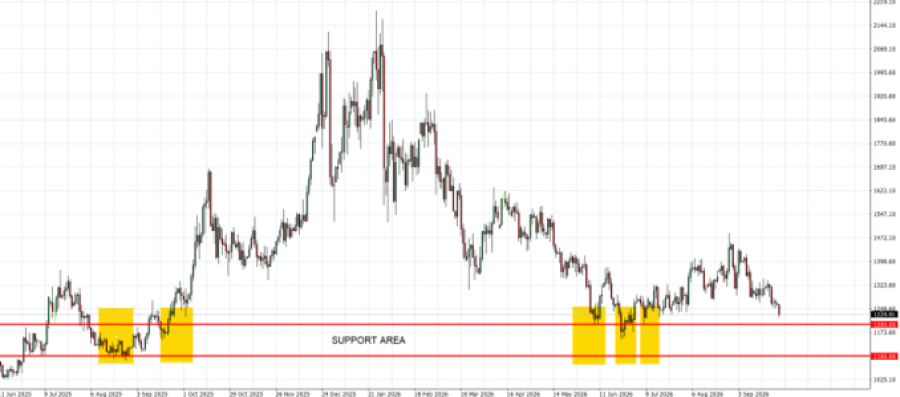
GRAPH (Daily): June 2025 - September 2026
Please note that past performance does not guarantee future results
Palladium, September 28, 2026
Current Price: 1,216
|
PALLADIUM |
Weekly |
|
Market Trend |
|
|
1,480 |
|
|
1,425 |
|
|
1,320 |
|
|
1,120 |
|
|
1,110 |
|
|
1,100 |
Example of calculation based on weekly market trend for 1.00 Lot1
|
PALLADIUM |
||||||
|
Pivot Points |
||||||
|
Profit or loss in $ |
26,400 |
20,900 |
10,400 |
-9,600 |
-10,600 |
-11,600 |
|
Profit or loss in €² |
23,236 |
18,395 |
9,154 |
-8,450 |
-9,330 |
-10,210 |
|
Profit or loss in £² |
19,929 |
15,777 |
7,851 |
-7,247 |
-8,002 |
-8,757 |
|
Profit or loss in C$² |
37,390 |
29,600 |
14,729 |
-13,596 |
-15,013 |
-16,429 |
- The above calculations are made based on 1.00 lot which is equivalent of 100 units
- Calculations for the exchange rate used as of 14:15 (GMT+1) 28/09/2026
You can use risk management tools such as Stop-Loss and Take-Profit


