BRENT OIL
October 21, 2026
Risk Disclaimer: The example below is for illustrative purposes only and is based on price movements derived from Contracts for Difference (CFDs). The calculations reflect hypothetical outcomes using historical or specified price data for the relevant instrument on the stated date and are not indicative of future performance. Any reliance placed on this material is strictly at the user’s own risk.
Weekly Special Report: BRENT OIL
BRENT OIL
- GLOBAL BENCHMARK: Brent crude is a major global oil benchmark, based on oil produced in the North Sea near the U.K. As a seaborne benchmark, it reflects global supply and demand dynamics. In contrast, WTI Crude oil (West Texas Intermediate), the main U.S. oil benchmark, is primarily produced in the United States and its price is strongly influenced by domestic supply, demand, storage levels, and pipeline infrastructure.
- BRENT OIL MORE VALUABLE THAN WTI (AMERICAN) OIL. Brent typically commands a higher price because of its direct exposure to international markets and global supply risks, although the price difference can vary depending on market conditions.
- SPREAD (PRICE DIFFERENCE) BETWEEN BRENT AND WTI (AMERICAN) OIL GETS WIDER WITH THE MIDDLE EAST WAR UNDERWAY. As a seaborne global benchmark, Brent is particularly sensitive to disruptions affecting international oil supplies and shipping routes, including the Strait of Hormuz. Escalating tensions or disruptions to production, pipelines, or tanker traffic can push Brent prices higher relative to WTI.
GEOPOLITICS: MIDDLE EAST WAR
- U.S.–IRAN CONFLICT: Continued military confrontations between the United States and Iran, including attacks involving oil tankers, could heighten supply concerns and sustain upward pressure on crude oil prices.
- YEMENI HOUTHIS–SAUDI ARABIA TENSIONS: Renewed hostilities could threaten Saudi oil infrastructure and shipping routes in the Red Sea. Any disruption to production or exports could tighten global oil supply and put upward pressure on crude oil prices.
- STRAIT OF HORMUZ AND BAB EL-MANDEB RISKS: Escalating security threats around these critical shipping routes could disrupt oil shipments, increase insurance and transportation costs, and delay deliveries. The Strait of Hormuz is particularly important due to the large volume of global oil supplies passing through it.
Sources: Reuters, CNBC, Bloomberg, OILPRICE.COM, Fox News
GLOBAL OIL MARKETS:
- POTENTIAL IMPACT: UP TO 30% OF TOTAL GLOBAL OIL DEMAND AT RISK. Total potential disruption could reach up to 28 million barrels per day, equivalent to nearly 30% of total global oil demand. If both the Strait of Hormuz and the Bab el-Mandeb Strait were completely shut down, the impact on global oil supply would be extremely significant, as two of the world’s most important energy chokepoints would be blocked simultaneously.
- SUPPLY LOSS ACCUMULATING: The Middle East conflict has caused significant disruptions to global oil flows, with cumulative global observed inventories standing approximately 509 million barrels below pre-war levels by the end of September 2026. Continued disruptions to exports and declining inventories could sustain upward pressure on crude oil prices.
Sources: Reuters, CNBC, Bloomberg, OILPRICE.COM, Financial Times, IEA
TECHNICAL ANALYSIS
-
-
-
- BREAKING (OCTOBER 20, 2026): BRENT OIL HITS ITS HIGHEST LEVEL SINCE MAY 2026 ($111.94). Brent oil prices continued to rise in October, gaining approximately 60%, or $41.84, from the July low of $70.10.
- SUPPORT AREA: $100–$95. Brent oil has maintained support in the $100–$95 region, trading predominantly above this range since early September 2026.
-
-
- BREAKING (MARCH 9, 2026): BRENT OIL PRICE HITS ITS HIGHEST LEVEL SINCE JUNE 2022 ($119.43). Brent crude was last trading around $110. A recovery to $119.43 would represent potential upside of approximately 8.5%, although prices could decline instead.
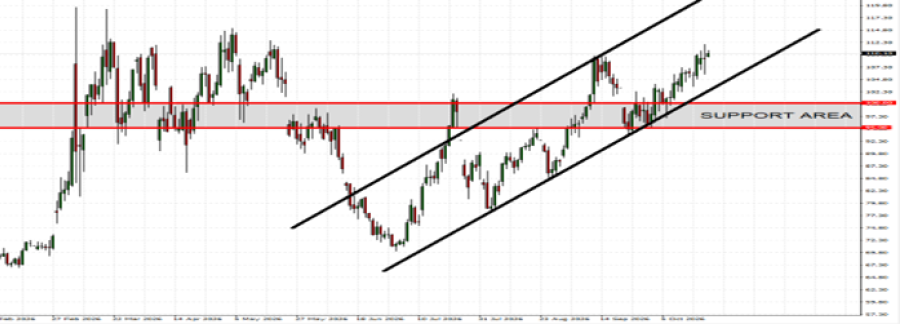
GRAPH (Daily): February 2026 – October 2026
Please note that past performance does not guarantee future results
Brent Oil, October 21, 2026
Current Price: 109.70
|
Brent Oil |
Weekly |
|
Market Trend |
|
|
130 |
|
|
125 |
|
|
120 |
|
|
100 |
|
|
97 |
|
|
95 |
Example of calculation based on weekly market trend for 1.00 Lot1
|
BRENT OIL |
||||||
|
Pivot Points |
||||||
|
Profit or loss in $ |
20,300 |
15,300 |
10,300 |
-9,700 |
-12,700 |
-14,700 |
|
Profit or loss in €2 |
18,093 |
13,636 |
9,180 |
-8,645 |
-11,319 |
-13,102 |
|
Profit or loss in £2 |
15,152 |
11,420 |
7,688 |
-7,240 |
-9,479 |
-10,972 |
|
Profit or loss in C$2 |
28,520 |
21,495 |
14,471 |
-13,628 |
-17,843 |
-20,652 |
- The above calculations are made based on 1.00 lot which is equivalent of 1000 units
- Calculations for exchange rate used as of 09:50 (GMT+1) 21/10/2026
You can use risk management tools such as Stop-Loss and Take-Profit


