COCOA (#COCOA)
November 17, 2026
Risk Disclaimer: The example below is for illustrative purposes only and is based on price movements derived from Contracts for Difference (CFDs). The calculations reflect hypothetical outcomes using historical or specified price data for the relevant instrument on the stated date and are not indicative of future performance. Any reliance placed on this material is strictly at the user’s own risk.
Weekly Special Report: COCOA (#COCOA)
FUNDAMENTALS:
- SUPPLY SIDE: Cocoa beans are grown primarily in West Africa, with the Ivory Coast (40% of the world’s total) and Ghana (18% of the world’s total). Behind them are Indonesia (11.4%), Ecuador (6,7%), and Brazil (5.2%).
- DEMAND SIDE: Demand for cocoa is strong and growing, especially from countries that are developing fast, like China and India, with a growing middle class eager to consume and gift chocolate. The demand for cocoa is as follows: Europe (35% of the world’s total), Asia and Oceania (21%), Africa (22%), and the Americas (North and South) (18%).
HARVEST SEASON:
- WEST AFRICAN COCOA HARVEST (NOVEMBER 2026): Ivory Coast port arrivals from October 1 to November 8 were just 228,475 MT, down 45% year on year. Crop estimates stand at 1.8 million metric Tons (-18%) for Ivory Coast and 650,000 metric tons (-13%) for Ghana. Prices remain volatile: they rallied about 3.5% on November 11 after hitting a 4.5-month low. If arrivals keep lagging because of heavy rains, disease or El Niño, the supply shortfall could support the Cocoa price.
EVENTS:
- EVENT (LATE NOVEMBER 2026): INTERNATIONAL COCOA ORGANIZATION (ICCO) NOVEMBER QUARTERLY BULLETIN OF COCOA STATISTICS. The global surplus keeps shrinking: this edition may give a first official read on whether El Niño and weak West African arrivals are moving 2026/27 into deficit. StoneX already expects a 64,000-metric-ton deficit, reversing its earlier forecast of a 25,000-metric-ton surplus.
- EVENT (NOVEMBER 2026 – JANUARY 2027): EL NIÑO PEAK AND HARMATTAN SEASON. El Niño’s peak is forecast between November 2026 and January 2027. El Niño is known to intensify the yearly Harmattan winds, which dry out topsoil and cause pods to fall. This window matters most for the late main crop and for setting up the April–September mid-crop. Exporters already see the mid-crop at 300,000–350,000 metric tons, down from about 600,000 metric tons last season.
Source: CNBC Africa, StoneX
NEWS:
- BREAKING (NOVEMBER 17, 2026): IVORY COAST COCOA DELIVERIES COLLAPSE AROUND 50%. Port arrivals from October 1 to November 8 were just 228,475 metric tons, down nearly 50% year on year. The gap widened in the latest week: farmers delivered 55,317 metric tons, roughly half the 107,139 metric tons of a year earlier. The world’s largest producer is now well into its main harvest, and supply has not caught up, providing potential upside to cocoa prices.
- BREAKING (NOVEMBER 2026): EL NIÑO PUTS UP TO A QUARTER OF IVORY COAST’S CROP AT RISK. Ivory Coast’s national weather agency warns that an exceptionally strong El Niño could cut 2026/27 production by 21% to 25%. Pod counters and exporters have already lowered their estimates to 1.5–1.6 million tons, 25% to 30% below last season’s 2.15 million metric tons. Exporters say arrivals are running below their own forecasts. In Ghana, the world’s second-largest producer, black pod disease and aging trees point to a 13% drop, to 650,000 metric tons.
Source: Yahoo Finance, Reuters, CNBC Africa
TECHNICAL ANALYSIS AND PRICE ACTION
- SUPPORT AREA: $4,600 - $4,000. Cocoa prices have previously established a strong technical support area between $4,600 and $4,000.
- ALL-TIME HIGH (DECEMBER 18, 2024): $12,911. Cocoa last traded around $5,188, and if the cocoa price tries to recover to its all-time high of $12,911, it could offer around 149% upside. Although prices can fall, too.
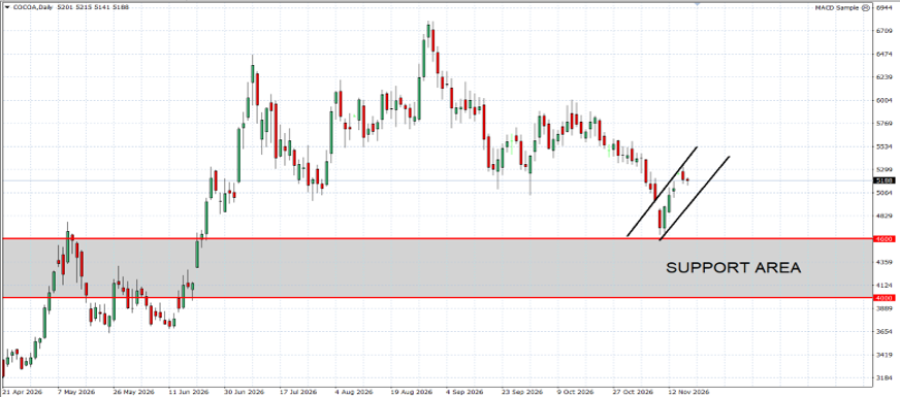
GRAPH (Daily): April 2026 - November 2026
Please note that past performance does not guarantee future results
#COCOA, November 17, 2026
Current Price: 5,188
|
Cocoa |
Weekly |
|
Market Trend |
|
|
6,800 |
|
|
6,500 |
|
|
5,900 |
|
|
4,600 |
|
|
4,250 |
|
|
4,100 |
Example of calculation based on weekly market trend for 1.00 Lot1
|
COCOA |
||||||
|
Pivot Points |
||||||
|
Profit or loss in $ |
16,120 |
13,120 |
7,120 |
-5,880 |
-9,380 |
-10,880 |
|
Profit or loss in €2 |
14,666 |
11,937 |
6,478 |
-5,350 |
-8,534 |
-9,899 |
|
Profit or loss in £2 |
12,218 |
9,944 |
5,396 |
-4,457 |
-7,109 |
-8,246 |
|
Profit or loss in C$2 |
23,040 |
18,752 |
10,177 |
-8,404 |
-13,407 |
-15,551 |
- The above calculations are made based on 1.00 lot which is equivalent of 10 units
- Calculations for exchange rate used as of 14:00 (GMT+1) 11/17/2026
You can use risk management tools such as Stop-Loss and Take-Profit


