Copper
September 21, 2026
Risk Disclaimer: The example below is for illustrative purposes only and is based on price movements derived from Contracts for Difference (CFDs). The calculations reflect hypothetical outcomes using historical or specified price data for the relevant instrument on the stated date and are not indicative of future performance. Any reliance placed on this material is strictly at the user’s own risk.
Weekly Special Report: Copper
COPPER USE AND MARKET SHARE:
- TOP COPPER PRODUCERS: Chile (23% of global mine production), the Democratic Republic of the Congo (14%), Peru (11%), China (8%), the United States (5%), Indonesia (4%), Russia (4%), Zambia (4%), Australia (3%), Mexico (3%), Kazakhstan (3%), and Canada (2%).
- TOP COPPER CONSUMERS: China (58% of the world’s total), the European Union (8%), the United States (7%), and Japan (4%).
- TOP COPPER INDUSTRIES: Copper is heavily demanded in the EV (Electric Vehicles) industry, renewable energy industry (wind & solar farms), electrical infrastructure, telecommunications, and construction. The EV and green industries show the biggest growth rates (10-15% and 5%, respectively).
GEOPOLITICS: U.S. – CHINA SUMMIT
- SEPTEMBER 23 – SEPTEMBER 25: U.S. – CHINA TRADE TALKS. The meeting could improve U.S.–China trade relations, supporting Chinese manufacturing, infrastructure spending and demand for copper. China accounts for roughly half of global refined copper consumption, so lower tariffs and fewer trade restrictions could boost economic activity and copper demand.
- POTENTIAL IMPACT: Stronger Chinese demand could provide potential support for copper prices, making any signs of a trade deal or increased economic support measures important for the market.
U.S. TARIFFS
- U.S. COPPER TARIFF DECISION DELAYED, BUT TARIFF THREAT REMAINS: The White House has delayed a decision on tariffs on refined copper. However, the tariff threat remains unresolved, with a potential 15% tariff from January 2027 rising to 30% in 2028 still under consideration. If the issue returns and tariffs are ultimately introduced, renewed stockpiling and tighter global availability could push copper prices potentially higher.
Source: Reuters
EVENTS (U.S.A.):
- WEDNESDAY, SEPTEMBER 23 AT 14:45 GMT+1: U.S. MANUFACTURING PMI (SEPTEMBER). Investors will watch for signs of stronger manufacturing demand. A stronger print could signal resilient industrial demand, supporting copper prices and economic growth. In August, US Manufacturing PMI came in at 53.9.
EVENTS (CHINA):
- WEDNESDAY, SEPTEMBER 30 AT 02:30 GMT+1: CHINA MANUFACTURING PMI (SEPTEMBER). Investors will watch for signs of stronger manufacturing activity and demand. A stronger print could point to higher copper consumption in China, supporting copper prices. In August, China Manufacturing PMI came in at 49.8.
TECHNICAL ANALYSIS:
- UPTREND: Copper prices have risen around 50% over the past year. However, copper prices could decline, too.
- SUPPORT AREA: $6.550 - $6.450: The area between $6.550 and $6.450 has acted as a support region since early May 2026.
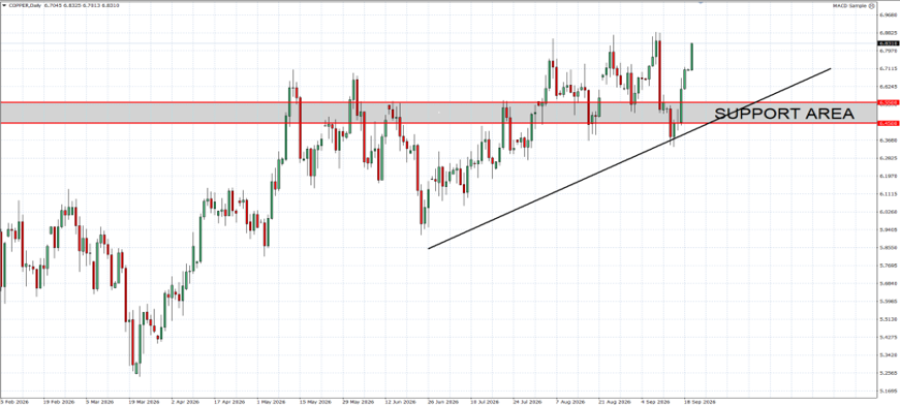
GRAPH (Daily): February 2026 – September 2026
Please note that past performance does not guarantee future results
Copper, September 21, 2026
Current Price: 6.770
|
COPPER |
Weekly |
|
Market Trend |
|
|
7.500 |
|
|
7.200 |
|
|
7.000 |
|
|
6.550 |
|
|
6.500 |
|
|
6.450 |
Example of calculation based on weekly market trend for 1.00 Lot1
|
COPPER |
||||||
|
Pivot Points |
||||||
|
Profit or loss in $ |
7,300 |
4,300 |
2,300 |
-2,200 |
-2,700 |
-3,200 |
|
Profit or loss in €2 |
6,362 |
3,747 |
2,004 |
-1,917 |
-2,353 |
-2,789 |
|
Profit or loss in £2 |
5,456 |
3,214 |
1,719 |
-1,644 |
-2,018 |
-2,392 |
|
Profit or loss in C$2 |
10,223 |
6,022 |
3,221 |
-3,081 |
-3,781 |
-4,481 |
1. The above calculations are made based on 1.00 lot which is equivalent of 10,000 units
2. Calculations for exchange rate used as of 14:30 (GMT+1) 21/09/2026
You can use risk management tools such as Stop-Loss and Take-Profit


