GOLD
October 5, 2026
Risk Disclaimer: The example below is for illustrative purposes only and is based on price movements derived from Contracts for Difference (CFDs). The calculations reflect hypothetical outcomes using historical or specified price data for the relevant instrument on the stated date and are not indicative of future performance. Any reliance placed on this material is strictly at the user’s own risk.
Weekly Special Report: Gold
EVENTS
- THURSDAY, OCTOBER 8 AT 13:30 GMT+1: U.S. WEEKLY INITIAL JOBLESS CLAIMS. U.S. employment has been weakening over the past years, with last week’s NFP and unemployment reports showing further signs of weakness. Employment data remains a key focus for investors and the Federal Reserve, and another weak employment reading could weigh on the U.S. dollar and support gold prices.
- WEDNESDAY, OCTOBER 14 AT 13:30 GMT+1: U.S. CPI INFLATION (SEPTEMBER). U.S. inflation will remain a key focus for the Federal Reserve. A lower-than-expected reading could reduce expectations of further interest rate hikes, potentially weighing on the U.S. dollar and supporting gold prices. Headline inflation (CPI) in the USA currently stands at 3.4%.
- THURSDAY, OCTOBER 15 AT 13:30 GMT+1: U.S. RETAIL SALES (SEPTEMBER). Retail sales provide an important indication of the strength of U.S. consumer spending. A weaker reading could signal slowing economic activity, potentially weighing on the U.S. dollar and supporting gold prices. Headline retail sales rose 1.2% on a monthly basis in August.
- THURSDAY, OCTOBER 15 AT 13:30 GMT+1: U.S. PRODUCERS’ PRICE INDEX (PPI) INFLATION (SEPTEMBER). Producer prices provide another important indication of inflationary pressures in the U.S. economy. A lower-than-expected reading could reduce expectations of further Fed interest rate hikes, potentially weighing on the U.S. dollar and supporting gold prices. Headline PPI in the USA currently stands at 5.4%.
U.S. MIDTERM ELECTIONS AND GOLD PRICE ACTION:
- U.S. MIDTERM ELECTIONS: NOVEMBER 3, 2026. The midterm elections take place halfway through a US president’s four-year term. This year, they will be held on November 3, 2026. Voters will elect all 435 members of the House of Representatives and 35 of the 100 members of the Senate. The results will determine which party, the Democrats or the Republicans, controls each chamber of Congress for the following two years. Currently, President Donald Trump is a Republican, while Republicans hold a narrow majority in both chambers of Congress, with 219 seats in the House and 53 seats in the Senate.
- GOLD HAS HISTORICALLY PERFORMED STRONGLY DURING U.S. ELECTION YEARS. Since 2000, gold has risen in 10 of 13 U.S. election years, with an average gain of 11.1%.
- MIDTERM ELECTION YEARS: Gold rose in 4 of 6 midterm election years since 2000, with an average gain of 11.8%.
- WHEN DONALD TRUMP WAS INVOLVED IN ELECTIONS: Donald Trump was involved as a presidential candidate in 2016, 2020, and 2024, and was the sitting president in 2018 during the 2018 Midterm Elections. During U.S. election years involving Donald Trump, gold gained an average of 14.72%.
Data Source: Investing.com
U.S. FEDERAL RESERVE:
- WEDNESDAY, OCTOBER 28 AT 18:00 GMT+1: U.S. FEDERAL RESERVE (FED) INTEREST RATE DECISION. The Fed interest rate currently stands at 4.00%, with markets expecting that interest rates will remain unchanged at the October meeting. This could put negative pressure on the U.S. dollar, supporting gold prices.
TECHNICAL ANALYSIS AND PRICE ACTION:
- SUPPORT AREA: $4,100 - $4,000. After recently falling, Gold is back near its strongest support area around $4,100–$4,000. Gold has tested this region on 10 occasions over the past year, repeatedly rebounding from these levels. Following these tests, Gold has rebounded to an average high of approximately $4,345, with an average price increase of around $362. Although the price could also fall.
- GOLD PRICE HIT A NEW ALL-TIME HIGH ON JANUARY 28, 2026 ($5,597.41). Gold price currently trades at around $4,155, and if it fully recovers to its previous all-time high, it could see an upside of around 35%. However, the price could also decline.
- FORECAST: Wells Fargo forecasts $4,900; Bank of America forecasts $4,800; Goldman Sachs forecasts $4,650; Morgan Stanley forecasts $5,200; UBS forecasts $5,500; JPMorgan forecasts $6,000; Deutsche Bank forecasts $4,800; Citigroup forecasts $5,000; Societe General forecasts $6,000.
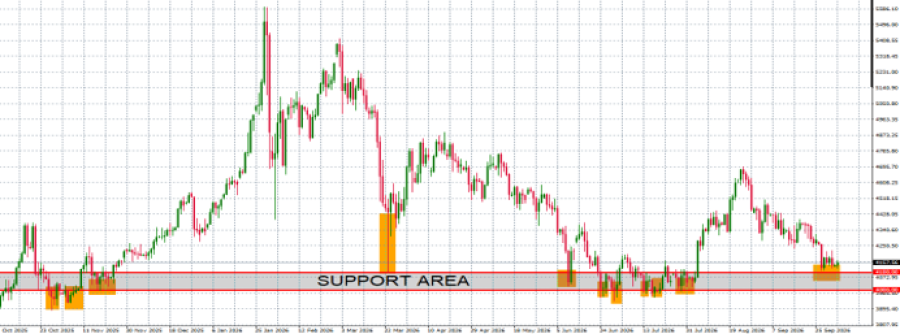
GRAPH (Daily): October 2025 – October 2026
Please note that past performance does not guarantee future results
Gold, October 5, 2026
Current Price: 4,155
|
GOLD |
Weekly |
|
Market Trend |
|
|
4,400 |
|
|
4,345 |
|
|
4,280 |
|
|
4,040 |
|
|
4,020 |
|
|
4,000 |
Example of calculation based on weekly market trend for 1.00 Lot1
|
GOLD |
||||||
|
Pivot Points |
||||||
|
Profit or loss in $ |
24,500 |
19,000 |
12,500 |
-11,500 |
-13,500 |
-15,500 |
|
Profit or loss in €² |
21,868 |
16,959 |
11,157 |
-10,264 |
-12,049 |
-13,835 |
|
Profit or loss in £² |
18,526 |
14,367 |
9,452 |
-8,696 |
-10,208 |
-11,720 |
|
Profit or loss in C$² |
34,917 |
27,078 |
17,815 |
-16,389 |
-19,240 |
-22,090 |
- The above calculations are made based on 1.00 lot which is equivalent of 100 units
- Calculations for exchange rate used as of 11:50 (GMT+1) 05/10/2026
You can use risk management tools such as Stop-Loss and Take-Profit.


