GOLD
November 20, 2026
Risk Disclaimer: The example below is for illustrative purposes only and is based on price movements derived from Contracts for Difference (CFDs). The calculations reflect hypothetical outcomes using historical or specified price data for the relevant instrument on the stated date and are not indicative of future performance. Any reliance placed on this material is strictly at the user’s own risk.
Weekly Special Report: Gold
ECONOMIC DATA
- MONDAY, NOVEMBER 23, AT 15:45 GMT+1: U.S. S&P GLOBAL MANUFACTURING AND SERVICES PMI (NOVEMBER). Weaker than expected readings could signal slowing economic activity, potentially reducing expectations of further Fed interest rate hikes, weakening the U.S. dollar and supporting gold prices.
- TUESDAY, NOVEMBER 24, AT 16:00 GMT+1: U.S. CB CONSUMER CONFIDENCE (NOVEMBER). A lower than expected reading could indicate weakening consumer confidence and concerns about the U.S. economy, potentially supporting gold prices.
- WEDNESDAY, NOVEMBER 25, AT 14:30 GMT+1: U.S. CORE PCE PRICE INDEX (OCTOBER). This is the Federal Reserve's preferred inflation indicator. Following recent higher than expected inflation data, a lower than expected reading could reduce expectations of further Fed interest rate hikes, weaken the U.S. dollar and support gold prices.
- WEDNESDAY, NOVEMBER 25, AT 14:30 GMT+1: U.S. GDP (Q3). A weaker than expected GDP reading could indicate slowing U.S. economic growth, potentially reducing expectations of further Fed interest rate hikes and supporting gold prices.
U.S. MIDTERM ELECTIONS:
- BREAKING (NOVEMBER 3): U.S. DEMOCRATS WIN CONTROL OF BOTH CHAMBERS OF CONGRESS. Democrats secured major victories in the U.S. midterm elections, taking control of both the House of Representatives and the Senate and ending Republican control of Congress. This creates a divided government under President Trump, potentially increasing political uncertainty and making it harder to pass new legislation.
- EVENT (FRIDAY, DECEMBER 11): U.S. GOVERNMENT FACES ANOTHER SHUTDOWN DEADLINE. President Trump signed a temporary funding bill in September, keeping the government operational until December 11, 2026. Congress must reach a new funding agreement before then to avoid another shutdown.
- GOLD PRICE PERFORMANCE DURING THE 2025 U.S. GOVERNMENT SHUTDOWN. During the last full U.S. government shutdown, which lasted 43 days (October 1 – November 12, 2025), gold prices rose by $382.04 (+11.0%) in the month before, $340.22 (+8.8%) during the shutdown, and $103.70 (+2.5%) in the month after.
Source: Investing, Reuters
Please note that past performance does not guarantee future results
GOLD AND CENTRAL BANKS:
- CHINA EXTENDS GOLD PURCHASES TO TWO YEARS: China purchased gold for the 24th consecutive month in October 2026. The People's Bank of China added 25.8 metric tons (830,000 ounces), its largest monthly increase in approximately three years. China's total gold reserves reached 78.30 million ounces (2,435 tons), with approximately 129 tons purchased in 2026.
- POLAND BECOMES THE WORLD'S LARGEST GOLD PURCHASER IN 2026: Poland purchased approximately 150 tons of gold during the first 10 months of 2026, making it the largest central bank purchaser of the year, ahead of China. Its total gold reserves reached a record 700 tons in October.
- GLOBAL CENTRAL BANK DEMAND REMAINS STRONG: According to the World Gold Council, central banks purchased 321 tons of gold in Q3 2026, up 42% compared with the same period last year, the highest quarterly total since Q4 2024. Total purchases reached 675 tons in the first nine months of 2026, up 6% year over year.
Sources: Reuters, World Gold Council, Yahoo Finance, China Daily
PRICE ACTION AND TECHNICAL ANALYSIS:
- SUPPORT AREA: $3,450–$3,250. Following the recent decline, gold is approaching the $3,450–$3,250 support area, which acted as an important technical zone between April and August 2025. Holding above this area could support a rebound, although prices could also decline further.
- GOLD'S RSI ENTERS OVERSOLD TERRITORY FOR THE FOURTH TIME SINCE 2025. Gold's daily Relative Strength Index (RSI) has fallen below 30, indicating oversold conditions. On the previous three occasions over the past year, gold prices subsequently rebounded by an average of $476.26, reaching their next short-term high within an average of 13 days. Although prices could move in the other direction as well.
- FORECASTS: Wells Fargo: $5,200; Bank of America: $5,000; Morgan Stanley: $5,250; UBS: $5,000; JPMorgan: $4,500; Deutsche Bank: $5,150; Citigroup: $5,000; Societe General: $5,000; Goldman Sachs: $5,600
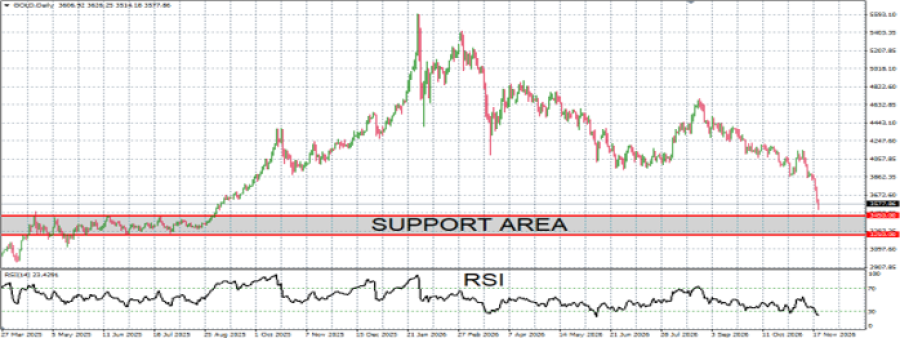
GRAPH (Daily): October 2025 – November 2026
Please note that past performance does not guarantee future results
Gold, November 20, 2026
Current Price: 3,570
|
GOLD |
Weekly |
|
Market Trend |
|
|
3,900 |
|
|
3,830 |
|
|
3,760 |
|
|
3,400 |
|
|
3,360 |
|
|
3,320 |
Example of calculation based on weekly market trend for 1.00 Lot1
|
GOLD |
||||||
|
Pivot Points |
||||||
|
Profit or loss in $ |
33,000 |
26,000 |
19,000 |
-17,000 |
-21,000 |
-25,000 |
|
Profit or loss in €² |
30,095 |
23,711 |
17,327 |
-15,504 |
-19,151 |
-22,799 |
|
Profit or loss in £² |
25,189 |
19,846 |
14,503 |
-12,976 |
-16,029 |
-19,083 |
|
Profit or loss in C$² |
47,267 |
37,241 |
27,215 |
-24,350 |
-30,079 |
-35,809 |
- The above calculations are made based on 1.00 lot which is equivalent of 100 units
- Calculations for exchange rate used as of 09:05 (GMT) 20/11/2026
You can use risk management tools such as Stop-Loss and Take-Profit.


