Fortrade Canada Ltd. as an order-execution only dealer is not permitted to provide you with any advice or recommendations. These Market Commentaries should not be construed as a recommendation, advice or any attempt by Fortrade Canada Ltd. to prompt or influence you in making an investment decision to purchase, sell, hold or exchange any security or to influence the timing of such activity. This content is produced by Fortrade Limited which is not registered in any capacity with any securities regulatory authority in Canada.
70% of retail investor accounts lose money when trading CFDs with this provider.
CFDs are complex instruments and come with a high risk of losing money rapidly due to leverage. 70% of retail investor accounts lose money when trading CFDs with this provider. You should consider whether you understand how CFDs work and whether you can afford to take the high risk of losing your money.
67.52% of retail investor accounts lose money when trading CFDs with this provider.
CFDs are complex instruments and come with a high risk of losing money rapidly due to leverage. 67.52% of retail investor accounts lose money when trading CFDs with this provider. You should consider whether you understand how CFDs work and whether you can afford to take the high risk of losing all your money. Read full risk warning.
US Session Analysis for CFD Instruments 31/10/2025
Fundamental analysis
31 October, 2025
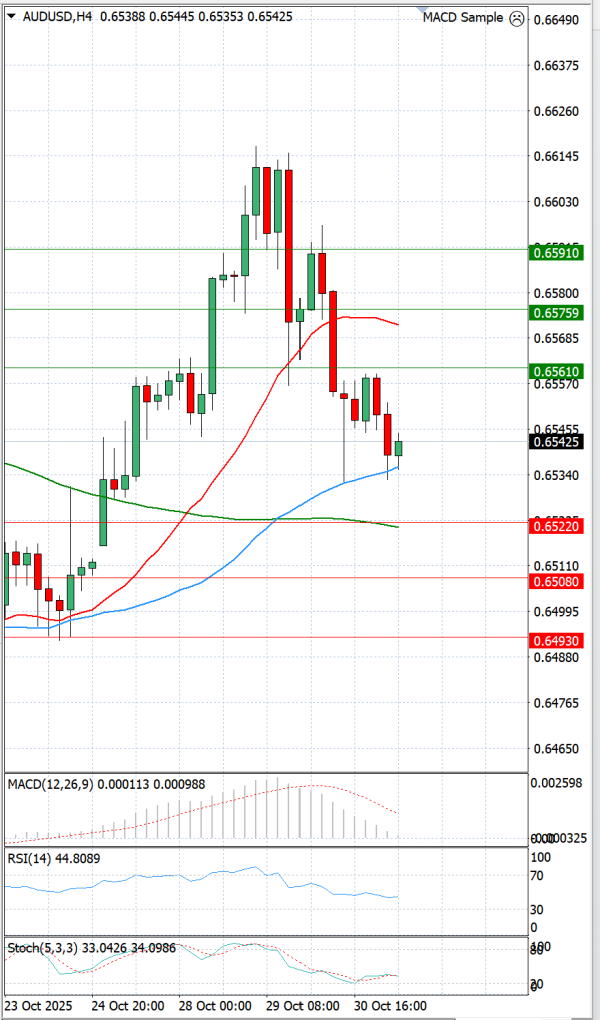
The Australian Dollar fell down against the US Dollar during European trading below 0.6600 levels.
The AUD/USD traded lower in the European session, as lower than expected Chinese manufacturing data is creating negative pressures on the aussie, given that China is Australia’s biggest trading partner. In Australia, PPI for Q3 came in higher than expected (at 1.0% realised vs 0.8% expected). In the US Core PCE Price Index data for September (0.2% exp) will be released (12:30 GMT).*
*Most US Government data will not be published (or will be delayed) because of a government shutdown. Non government US data will be released as normal.