Fortrade Canada Ltd. as an order-execution only dealer is not permitted to provide you with any advice or recommendations. These Market Commentaries should not be construed as a recommendation, advice or any attempt by Fortrade Canada Ltd. to prompt or influence you in making an investment decision to purchase, sell, hold or exchange any security or to influence the timing of such activity. This content is produced by Fortrade Limited which is not registered in any capacity with any securities regulatory authority in Canada.
71% of retail investor accounts lose money when trading CFDs with this provider.
CFDs are complex instruments and come with a high risk of losing money rapidly due to leverage. 71% of retail investor accounts lose money when trading CFDs with this provider. You should consider whether you understand how CFDs work and whether you can afford to take the high risk of losing your money.
70.91% of retail investor accounts lose money when trading CFDs with this provider.
CFDs are complex instruments and come with a high risk of losing money rapidly due to leverage. 70.91% of retail investor accounts lose money when trading CFDs with this provider. You should consider whether you understand how CFDs work and whether you can afford to take the high risk of losing all your money. Read full risk warning.
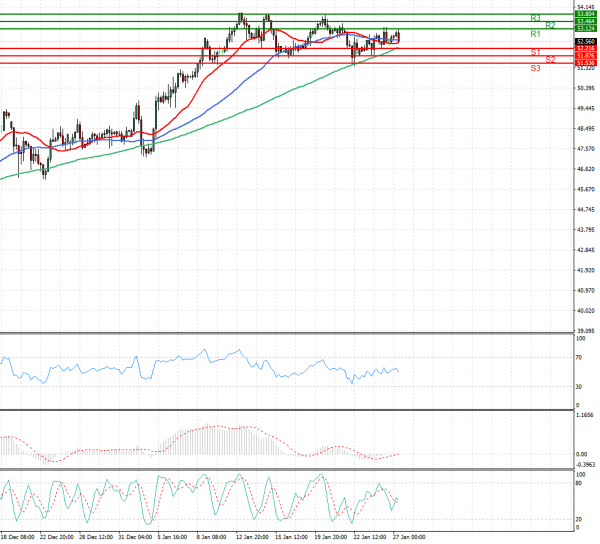
US Session Analysis for CFD Instruments 27/01/2021
Fundamental analysis
27 January, 2021
Oil prices grew on Wednesday after industry data showed U.S. crude inventories fell unexpectedly and as concerns eased about a resurgence in coronavirus cases in China, the world’s second-biggest oil user. Industry group the American Petroleum Institute said U.S. crude inventories fell by 5.3 million barrels. Analysts had expected them to rise. Official inventory figures are due at 1530 GMT from the Energy Information Administration. Official Chinese data showed 75 new confirmed cases of COVID-19 on Wednesday, the lowest daily rise since Jan. 11, easing concern of a sharp drop in travel over the Lunar New Year when hundreds of millions typically travel.