Fortrade Canada Ltd. as an order-execution only dealer is not permitted to provide you with any advice or recommendations. These Market Commentaries should not be construed as a recommendation, advice or any attempt by Fortrade Canada Ltd. to prompt or influence you in making an investment decision to purchase, sell, hold or exchange any security or to influence the timing of such activity. This content is produced by Fortrade Limited which is not registered in any capacity with any securities regulatory authority in Canada.
69% of retail investor accounts lose money when trading CFDs with this provider.
CFDs are complex instruments and come with a high risk of losing money rapidly due to leverage. 69% of retail investor accounts lose money when trading CFDs with this provider. You should consider whether you understand how CFDs work and whether you can afford to take the high risk of losing your money.
67.52% of retail investor accounts lose money when trading CFDs with this provider.
CFDs are complex instruments and come with a high risk of losing money rapidly due to leverage. 67.52% of retail investor accounts lose money when trading CFDs with this provider. You should consider whether you understand how CFDs work and whether you can afford to take the high risk of losing all your money. Read full risk warning.
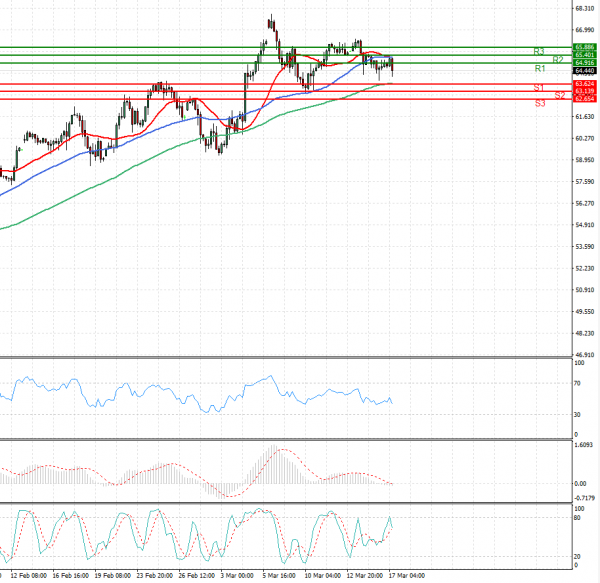
US Session Analysis for CFD Instruments 17/03/2021
Fundamental analysis
17 March, 2021
Oil slipped for a fourth day on Wednesday as concerns about weaker demand in Europe outweighed an industry report that showed U.S. crude stockpiles unexpectedly fell last week. Several European countries have paused the use of AstraZeneca’s COVID-19 vaccine due to worries over possible side effects. Germany is seeing rising coronavirus cases, while Italy is imposing a nationwide Easter lockdown. Oil also fell after the release of the latest reports from the International Energy Agency, which said a supercycle was unlikely, demand won’t return to pre-pandemic levels until 2023 and could peak earlier than previously thought. The market gained support from American Petroleum Institute data, which according to trading sources said U.S. crude inventories fell by 1 million barrels last week. Analysts had expected a rise. Traders will be looking to the official U.S. Energy Information Administration report at 1430 GMT for confirmation of the API figures.