Fortrade Canada Ltd. as an order-execution only dealer is not permitted to provide you with any advice or recommendations. These Market Commentaries should not be construed as a recommendation, advice or any attempt by Fortrade Canada Ltd. to prompt or influence you in making an investment decision to purchase, sell, hold or exchange any security or to influence the timing of such activity. This content is produced by Fortrade Limited which is not registered in any capacity with any securities regulatory authority in Canada.
69% of retail investor accounts lose money when trading CFDs with this provider.
CFDs are complex instruments and come with a high risk of losing money rapidly due to leverage. 69% of retail investor accounts lose money when trading CFDs with this provider. You should consider whether you understand how CFDs work and whether you can afford to take the high risk of losing your money.
67.52% of retail investor accounts lose money when trading CFDs with this provider.
CFDs are complex instruments and come with a high risk of losing money rapidly due to leverage. 67.52% of retail investor accounts lose money when trading CFDs with this provider. You should consider whether you understand how CFDs work and whether you can afford to take the high risk of losing all your money. Read full risk warning.
US Session Analysis for CFD Instruments 31/08/2023
Fundamental analysis
31 August, 2023
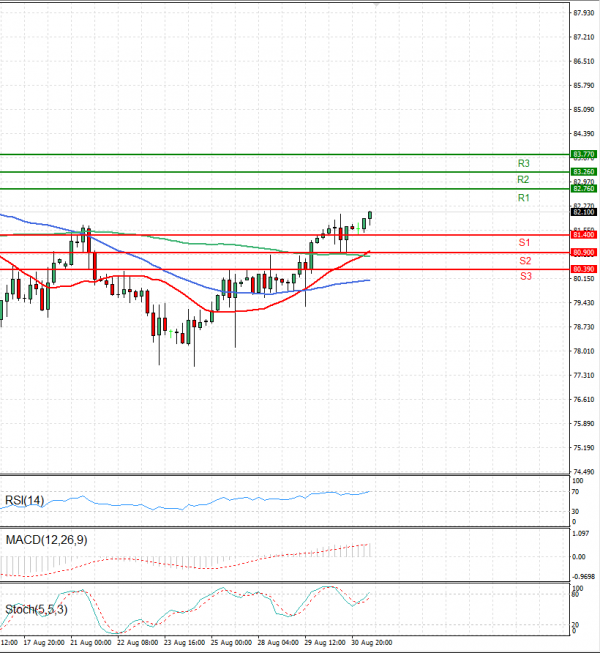
Crude Oil has broken through the $80 resistance and is currently trading at 82.03. WTI crude oil lacks clear directions while making rounds to $82.03 heading into Thursday’s European session. The black gold portrays the market’s cautious mood ahead of the key US inflation and employment clues while ignoring the heavy inventory draw and supply-crunch fears emanating from Hurricane Idalia. The price surge also comes on the heels of analyst sentiment that Saudi Arabia will rollover a voluntary oil cut of 1 million barrels per day for a third consecutive month in October adding to the cuts in place by OPEC+ and allies, led by Russia.