Fortrade Canada Ltd. as an order-execution only dealer is not permitted to provide you with any advice or recommendations. These Market Commentaries should not be construed as a recommendation, advice or any attempt by Fortrade Canada Ltd. to prompt or influence you in making an investment decision to purchase, sell, hold or exchange any security or to influence the timing of such activity. This content is produced by Fortrade Limited which is not registered in any capacity with any securities regulatory authority in Canada.
69% of retail investor accounts lose money when trading CFDs with this provider.
CFDs are complex instruments and come with a high risk of losing money rapidly due to leverage. 69% of retail investor accounts lose money when trading CFDs with this provider. You should consider whether you understand how CFDs work and whether you can afford to take the high risk of losing your money.
67.52% of retail investor accounts lose money when trading CFDs with this provider.
CFDs are complex instruments and come with a high risk of losing money rapidly due to leverage. 67.52% of retail investor accounts lose money when trading CFDs with this provider. You should consider whether you understand how CFDs work and whether you can afford to take the high risk of losing all your money. Read full risk warning.
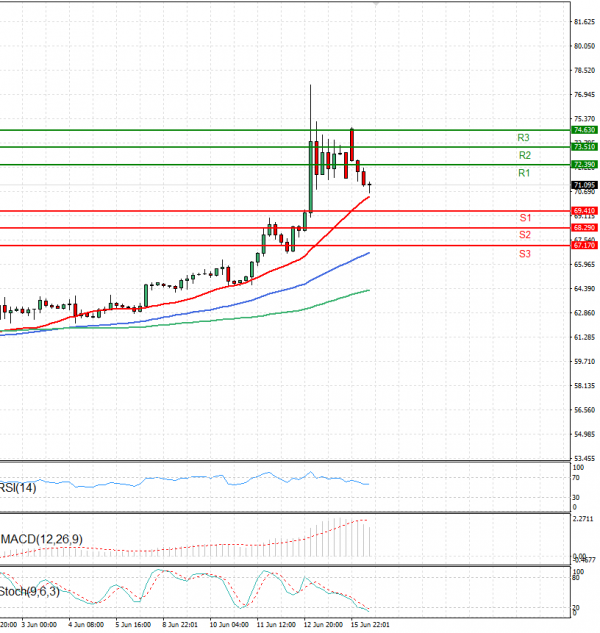
US Session Analysis for CFD Instruments 16/06/2025
Fundamental analysis
16 June, 2025
Crude Oil traded above the $70.80 level in the European session.
Oil prices dipped slightly on Monday, after a 7% surge on Friday, as weekend military strikes between Israel and Iran did not impact oil production or exports. Iran launched missiles at Tel Aviv and Haifa, raising global concerns about a wider conflict ahead of the G7 summit. Sunday’s attacks caused civilian casualties on both sides, with each military warning the other’s population to stay cautious. Attention is now focused on the Strait of Hormuz, a critical route for global oil supply, through which around 20% of the world’s oil — about 18–19 million barrels per day — flows.