Fortrade Canada Ltd. as an order-execution only dealer is not permitted to provide you with any advice or recommendations. These Market Commentaries should not be construed as a recommendation, advice or any attempt by Fortrade Canada Ltd. to prompt or influence you in making an investment decision to purchase, sell, hold or exchange any security or to influence the timing of such activity. This content is produced by Fortrade Limited which is not registered in any capacity with any securities regulatory authority in Canada.
69% of retail investor accounts lose money when trading CFDs with this provider.
CFDs are complex instruments and come with a high risk of losing money rapidly due to leverage. 69% of retail investor accounts lose money when trading CFDs with this provider. You should consider whether you understand how CFDs work and whether you can afford to take the high risk of losing your money.
70.88% of retail investor accounts lose money when trading CFDs with this provider.
CFDs are complex instruments and come with a high risk of losing money rapidly due to leverage. 70.88% of retail investor accounts lose money when trading CFDs with this provider. You should consider whether you understand how CFDs work and whether you can afford to take the high risk of losing all your money. Read full risk warning.
US Session Analysis for CFD Instruments 09/02/2026
Fundamental analysis
09 February, 2026
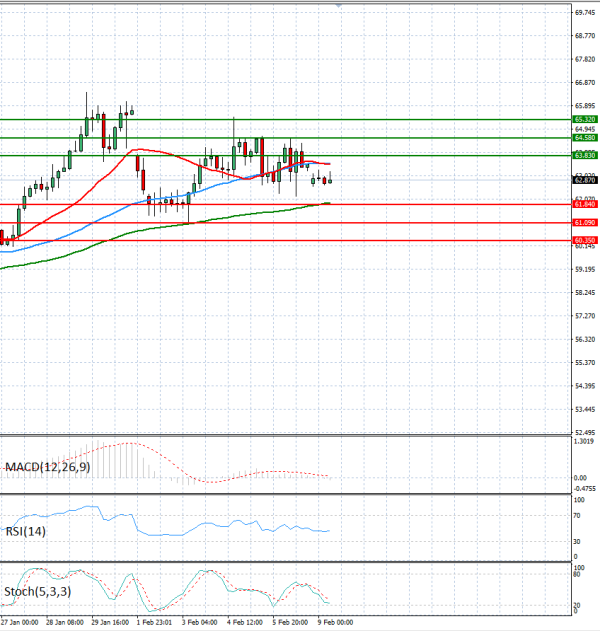
Crude Oil is trading today in the European session above the $63.50 level.
Oil prices are gaining momentum in the European session, as traders are still paying close attention to the high stakes US-Iran negotiations continuing this week, tensions remain high as both countries continue preparing military assets in the region. These negotiations could break down any moment and the situation can escalate, repeating what happened in June of 2025. Meanwhile, India has agreed to significantly reduce its purchases of Russian oil which can tighten supply and elevate demand in the Oil Markets.