CFDs are complex instruments and come with a high risk of losing money rapidly due to leverage. 77% of retail investor accounts lose money when trading CFDs with this provider. You should consider whether you understand how CFDs work and whether you can afford to take the high risk of losing your money.
CFDs are complex instruments and come with a high risk of losing money rapidly due to leverage. 76% of retail investor accounts lose money when trading CFDs with this provider. You should consider whether you can afford to take the high risk of losing your money.

Ger 40 Index Analysis

US Session Analysis for CFD Instruments 19/04/2024

Fundamental analysis

19 April, 2024

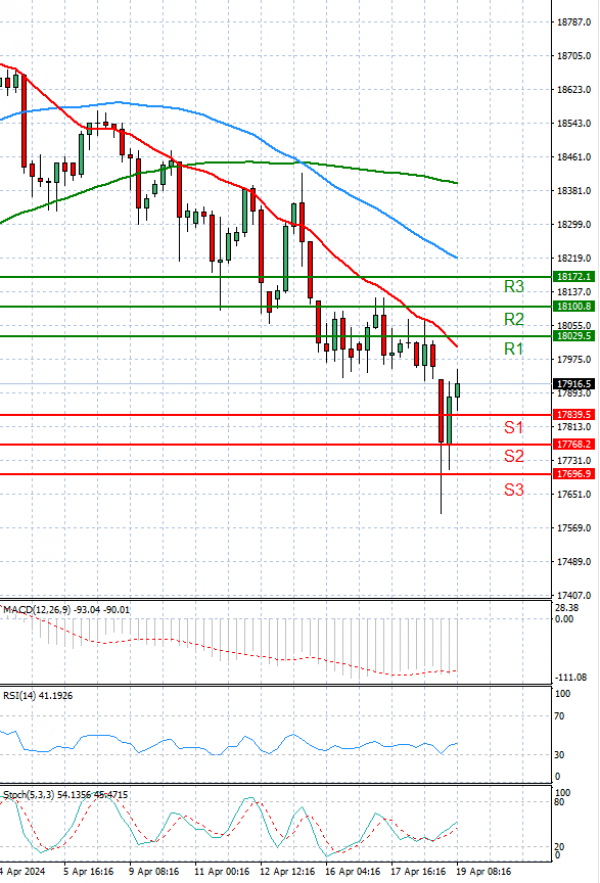
In the European session, the German Benchmark Index traded above 17,900 levels.

On Friday, European stocks witnessed a notable decline amid escalating tensions in the Middle East following Israel's retaliatory strikes against Iran. Additionally, hawkish remarks from Federal Reserve officials prompted investors to revise down their expectations for interest rate cuts by the Federal Reserve this year. Many market participants now anticipate the U.S. central bank to delay any rate cuts until September.

In economic news, Germany's producer prices continued their downward trend in March, albeit at the slowest rate in nine months. Producer prices showed an annual decline of 2.9 percent, a moderation from the 4.1 percent drop observed in January. This marks the continuation of price declines since July 2023.

The pan-European STOXX 600 index fell by 0.7 percent to 496.10, following a 0.2 percent gain on Thursday. The German DAX dropped by 0.9 percent, France's CAC 40 shed 0.8 percent, and the U.K.'s FTSE 100 was down by 0.7 percent.

Technical analysis

Ger 40 Index Analysis Technical analysis 19/04/2024
Time Frame: 1 hour

GER40 Support & Resistance Table - 19/04/2024

Support & Resistance Level Explanation
Resistance 2 18100.8 Daily R2
Resistance 1 18029.5 Daily R1
Support 1 17839.5 Daily S1
Support 2 17768.2 Daily S2

GER40 Indicator Table - 19/04/2024

Indicator Signal
SMA 20 Sell
SMA 50 Sell
SMA 100 Sell
MACD( 12;26;9) Sell
RSI (14) Sell
Stochastic ( 9;6;3) Sell

GER40 Indicator / Period Table - 19/04/2024

Indicator / Period Day - SellWeek - SellMonth - Buy
MACD( 12;26;9) Sell BuyBuy
RSI (14) Sell SellBuy
SMA 20 Sell SellBuy

GER40 19/04/2024 - Reference Price : 17934.5

Sell
Simple Moving AverageBuy (0)Sell (3)
Technical Indicators - OscillatorsBuy (0)Sell (3)
Share It With Your Network
Ger40 Chart
Update Time: -
Highest
Lowest
1M 5M H D W
Prices are loading..
Ready for trading?Start Now