Fortrade Canada Ltd. as an order-execution only dealer is not permitted to provide you with any advice or recommendations. These Market Commentaries should not be construed as a recommendation, advice or any attempt by Fortrade Canada Ltd. to prompt or influence you in making an investment decision to purchase, sell, hold or exchange any security or to influence the timing of such activity. This content is produced by Fortrade Limited which is not registered in any capacity with any securities regulatory authority in Canada.
69% of retail investor accounts lose money when trading CFDs with this provider.
CFDs are complex instruments and come with a high risk of losing money rapidly due to leverage. 69% of retail investor accounts lose money when trading CFDs with this provider. You should consider whether you understand how CFDs work and whether you can afford to take the high risk of losing your money.
67.52% of retail investor accounts lose money when trading CFDs with this provider.
CFDs are complex instruments and come with a high risk of losing money rapidly due to leverage. 67.52% of retail investor accounts lose money when trading CFDs with this provider. You should consider whether you understand how CFDs work and whether you can afford to take the high risk of losing all your money. Read full risk warning.
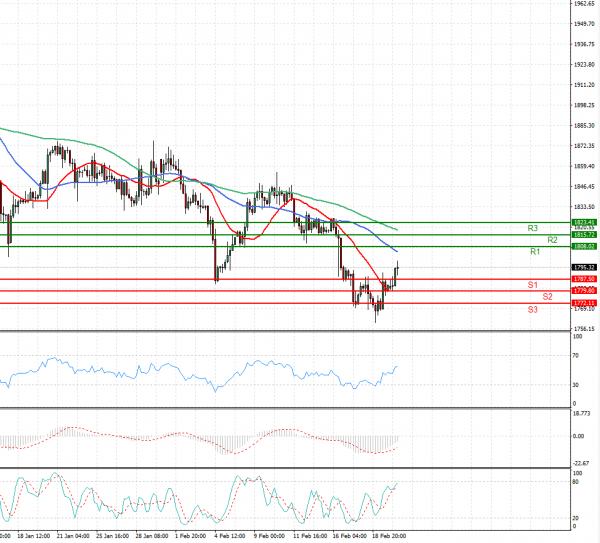
US Session Analysis for CFD Instruments 22/02/2021
Fundamental analysis
22 February, 2021
Gold prices on Monday bounced back from an over seven-month low hit in the prior session, shrugging off a jump in yields, with investors opting for the precious metal as a hedge against rising inflation. The dollar gained in early European trading as expectations for a faster economic growth due to expected fiscal aid sent bond yields higher. A $1.9 trillion stimulus is widely expected to pass by the end of the week, lifting sentiments for an increased economic recovery, but at the cost of rising inflation. Investors are also eyeing the testimony of Federal Reserve Chairman Jerome Powell on the Semiannual Monetary Report to Congress beginning Tuesday. The Fed and other major central banks have pinned their hopes on ultra low interest rates to get the economy out of the grasp of a COVID-19-led fall-out.