Fortrade Canada Ltd. as an order-execution only dealer is not permitted to provide you with any advice or recommendations. These Market Commentaries should not be construed as a recommendation, advice or any attempt by Fortrade Canada Ltd. to prompt or influence you in making an investment decision to purchase, sell, hold or exchange any security or to influence the timing of such activity. This content is produced by Fortrade Limited which is not registered in any capacity with any securities regulatory authority in Canada.
71% of retail investor accounts lose money when trading CFDs with this provider.
CFDs are complex instruments and come with a high risk of losing money rapidly due to leverage. 71% of retail investor accounts lose money when trading CFDs with this provider. You should consider whether you understand how CFDs work and whether you can afford to take the high risk of losing your money.
70.91% of retail investor accounts lose money when trading CFDs with this provider.
CFDs are complex instruments and come with a high risk of losing money rapidly due to leverage. 70.91% of retail investor accounts lose money when trading CFDs with this provider. You should consider whether you understand how CFDs work and whether you can afford to take the high risk of losing all your money. Read full risk warning.
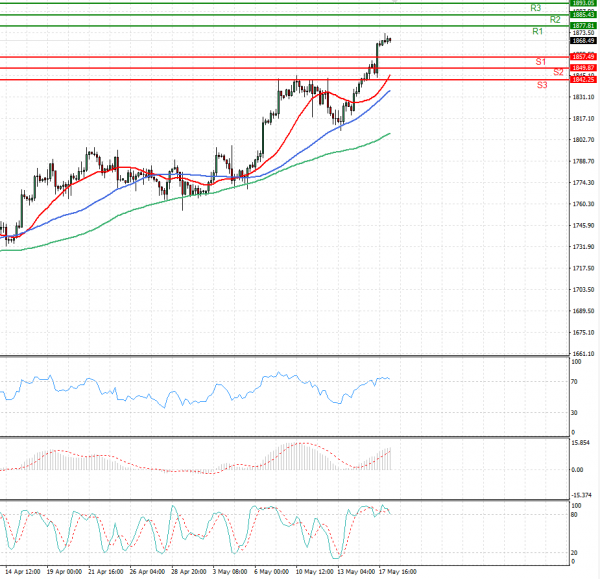
US Session Analysis for CFD Instruments 18/05/2021
Fundamental analysis
18 May, 2021
Gold prices firmed on Tuesday after hitting their highest in nearly four months, helped by a weaker U.S. dollar and as investors used the non-yielding bullion as a hedge against rising inflation. Analysts also noted that inflows into gold exchange-traded-funds indicated that investors were buying gold to hedge against inflation worries.Holdings of SPDR Gold Trust, the world’s largest gold-backed exchange-traded fund, rose 0.7% to 1,035.93 tonnes on Monday, their highest since late-March. In the wake of rising prices in the United States, minutes of the Federal Reserve’s last policy meeting due on Wednesday are expected to provide further clarity on the central bank’s monetary policy outlook and policymakers’ views on inflation.