Fortrade Canada Ltd. as an order-execution only dealer is not permitted to provide you with any advice or recommendations. These Market Commentaries should not be construed as a recommendation, advice or any attempt by Fortrade Canada Ltd. to prompt or influence you in making an investment decision to purchase, sell, hold or exchange any security or to influence the timing of such activity. This content is produced by Fortrade Limited which is not registered in any capacity with any securities regulatory authority in Canada.
69% of retail investor accounts lose money when trading CFDs with this provider.
CFDs are complex instruments and come with a high risk of losing money rapidly due to leverage. 69% of retail investor accounts lose money when trading CFDs with this provider. You should consider whether you understand how CFDs work and whether you can afford to take the high risk of losing your money.
67.52% of retail investor accounts lose money when trading CFDs with this provider.
CFDs are complex instruments and come with a high risk of losing money rapidly due to leverage. 67.52% of retail investor accounts lose money when trading CFDs with this provider. You should consider whether you understand how CFDs work and whether you can afford to take the high risk of losing all your money. Read full risk warning.
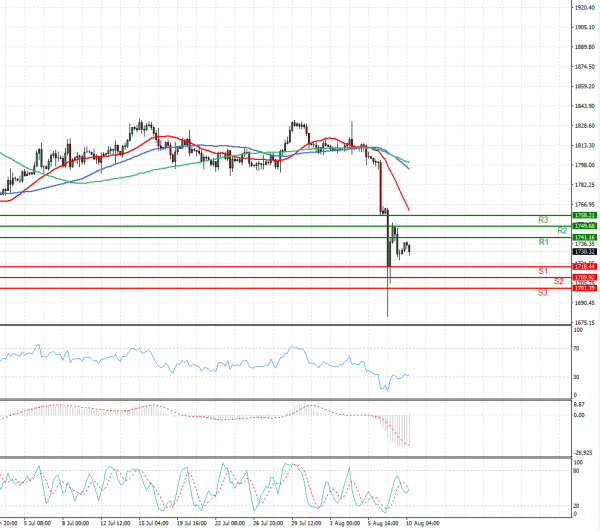
US Session Analysis for CFD Instruments 10/08/2021
Fundamental analysis
10 August, 2021
Gold prices rose on Tuesday after sharp sell-offs in the last two sessions, as demand for the safe-haven metal was spurred by a pause in the dollar’s rally, although fears of a sooner-than-expected U.S. interest rate hike capped bullion’s gains. Gold prices fell more than 4% in the last two sessions after better-than-expected U.S. jobs figures bolstered expectations for an early tapering of the Federal Reserve’s economic support measures. Investors now shift their focus to U.S. consumer inflation data due on Wednesday. Though gold is viewed as a hedge against higher inflation, a Fed rate hike would dull its appeal as it increases the opportunity cost of holding the non-yielding metal.