Fortrade Canada Ltd. as an order-execution only dealer is not permitted to provide you with any advice or recommendations. These Market Commentaries should not be construed as a recommendation, advice or any attempt by Fortrade Canada Ltd. to prompt or influence you in making an investment decision to purchase, sell, hold or exchange any security or to influence the timing of such activity. This content is produced by Fortrade Limited which is not registered in any capacity with any securities regulatory authority in Canada.
69% of retail investor accounts lose money when trading CFDs with this provider.
CFDs are complex instruments and come with a high risk of losing money rapidly due to leverage. 69% of retail investor accounts lose money when trading CFDs with this provider. You should consider whether you understand how CFDs work and whether you can afford to take the high risk of losing your money.
67.52% of retail investor accounts lose money when trading CFDs with this provider.
CFDs are complex instruments and come with a high risk of losing money rapidly due to leverage. 67.52% of retail investor accounts lose money when trading CFDs with this provider. You should consider whether you understand how CFDs work and whether you can afford to take the high risk of losing all your money. Read full risk warning.
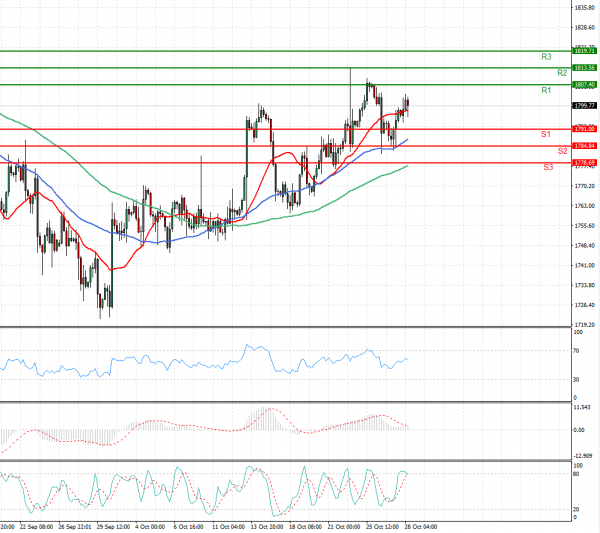
US Session Analysis for CFD Instruments 28/10/2021
Fundamental analysis
28 October, 2021
Gold rose on Thursday, hovering above the $1,800 mark as softer U.S. Treasury yields lifted its appeal, while investors await the European Central Bank’s remarks on inflation and policy outlook when it meets later in the day. Helping gold gain, benchmark 10-year U.S. Treasury yields traded close to a two-week trough. Gold is traditionally seen as an inflation hedge. However, reduced stimulus and interest rate hikes would push government bond yields up, translating into a higher opportunity cost for holding gold that pays no interest.The ECB is expected to keep policy unchanged and push back against growing expectations for an interest rate hike next year.