Fortrade Canada Ltd. as an order-execution only dealer is not permitted to provide you with any advice or recommendations. These Market Commentaries should not be construed as a recommendation, advice or any attempt by Fortrade Canada Ltd. to prompt or influence you in making an investment decision to purchase, sell, hold or exchange any security or to influence the timing of such activity. This content is produced by Fortrade Limited which is not registered in any capacity with any securities regulatory authority in Canada.
71% of retail investor accounts lose money when trading CFDs with this provider.
CFDs are complex instruments and come with a high risk of losing money rapidly due to leverage. 71% of retail investor accounts lose money when trading CFDs with this provider. You should consider whether you understand how CFDs work and whether you can afford to take the high risk of losing your money.
70.91% of retail investor accounts lose money when trading CFDs with this provider.
CFDs are complex instruments and come with a high risk of losing money rapidly due to leverage. 70.91% of retail investor accounts lose money when trading CFDs with this provider. You should consider whether you understand how CFDs work and whether you can afford to take the high risk of losing all your money. Read full risk warning.
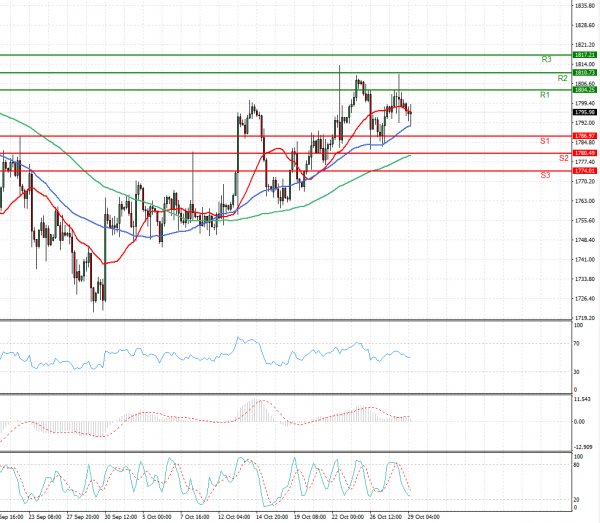
US Session Analysis for CFD Instruments 29/10/2021
Fundamental analysis
29 October, 2021
Gold prices were set on Friday for a third straight weekly gain, supported by a retreat in U.S. bond yields and dollar with investors focussing on the Federal Reserve’s response to inflationary pressure and concerns over tepid economic growth. Benchmark 10-year U.S. Treasury yields were set to mark their worst week in three months, reducing the opportunity cost of non-yielding bullion. The U.S. dollar was headed for a third straight weekly decline, making gold more attractive to buyers holding other currencies.Investors now await next week’s Fed policy meeting, after data showed the U.S. economy grew at a slower pace last quarter.