Fortrade Canada Ltd. as an order-execution only dealer is not permitted to provide you with any advice or recommendations. These Market Commentaries should not be construed as a recommendation, advice or any attempt by Fortrade Canada Ltd. to prompt or influence you in making an investment decision to purchase, sell, hold or exchange any security or to influence the timing of such activity. This content is produced by Fortrade Limited which is not registered in any capacity with any securities regulatory authority in Canada.
69% of retail investor accounts lose money when trading CFDs with this provider.
CFDs are complex instruments and come with a high risk of losing money rapidly due to leverage. 69% of retail investor accounts lose money when trading CFDs with this provider. You should consider whether you understand how CFDs work and whether you can afford to take the high risk of losing your money.
70.88% of retail investor accounts lose money when trading CFDs with this provider.
CFDs are complex instruments and come with a high risk of losing money rapidly due to leverage. 70.88% of retail investor accounts lose money when trading CFDs with this provider. You should consider whether you understand how CFDs work and whether you can afford to take the high risk of losing all your money. Read full risk warning.
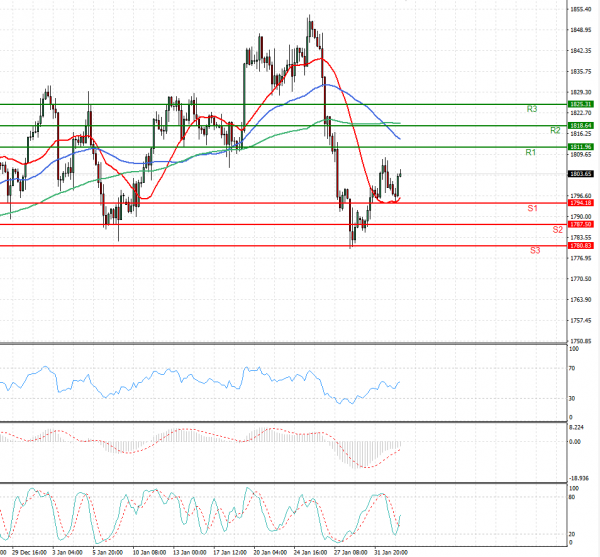
US Session Analysis for CFD Instruments 02/02/2022
Fundamental analysis
02 February, 2022
Gold prices edged lower on Wednesday, moving away from the key psychological level of $1,800, as risk appetite spurred by less hawkish comments from U.S. Federal Reserve officials outweighed support from lower Treasury yields. Although gold is considered a hedge against inflation, rate hikes would raise the opportunity cost of holding non-yielding bullion.