CFDs are complex instruments and come with a high risk of losing money rapidly due to leverage. 71% of retail investor accounts lose money when trading CFDs with this provider. You should consider whether you understand how CFDs work and whether you can afford to take the high risk of losing your money.
CFDs are complex instruments and come with a high risk of losing money rapidly due to leverage. 70.91% of retail investor accounts lose money when trading CFDs with this provider. You should consider whether you understand how CFDs work and whether you can afford to take the high risk of losing all your money. Read full risk warning.

Gold - Usd Dollar Analysis

US Session Analysis for CFD Instruments 29/04/2022

Fundamental analysis

29 April, 2022

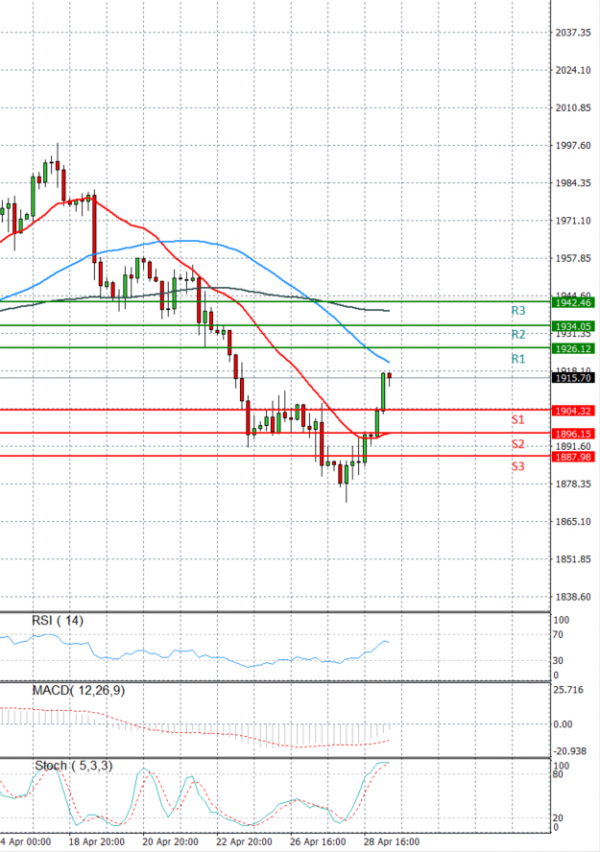
The price of gold rose on Friday morning in Asia, as worrying data on US GDP forced some investors to "safe haven" instrument. However, the yellow metal is set for the biggest monthly drop since September 2021 because the US Federal Reserve is expected to aggressively raise interest rates when it makes its policy decision next week. Jerome Powell, chairman of the US Federal Reserve, said last week that he to increase the interest rate by half a percent, which, until recently, was not the case. There is also speculation that the Fed, at least according to the efforts of a number of decision-makers, could, at the next meeting on May 4, increase the interest rate by as much as 0.75% (which is less certain). That, along with the further growth of yields on long-term US bonds, is (currently) putting pressure on the price of gold. Early this morning, the price of gold was trading around 1915 dollars per fine ounce, which represents a price increase of 1.05% since the beginning of trading on Friday.

Technical analysis

Gold - Usd Dollar Analysis Technical analysis 29/04/2022
Time Frame: 1 hour

GOLD Support & Resistance Table - 29/04/2022

Support & Resistance Level Explanation
Resistance 2 1934.29 Daily R2
Resistance 1 1926.12 Daily R1
Support 1 1904.32 Daily S1
Support 2 1896.15 Daily S2

GOLD Indicator Table - 29/04/2022

Indicator Signal
SMA 20 Buy
SMA 50 Sell
SMA 100 Sell
MACD( 12;26;9) Sell
RSI (14) Buy
Stochastic ( 9;6;3) Buy

GOLD Indicator / Period Table - 29/04/2022

Indicator / Period Day - BuyWeek - SellMonth - Buy
MACD( 12;26;9) Sell NeutralBuy
RSI (14) Buy SellBuy
SMA 20 Buy SellBuy

GOLD 29/04/2022 - Reference Price : 1915.22

Buy
Simple Moving AverageBuy (1)Sell (2)
Technical Indicators - OscillatorsBuy (2)Sell (1)
Share It With Your Network
GOLD Chart
Update Time: -
Highest
Lowest
1M 5M H D W
Prices are loading..
Ready for trading?Start Now