CFDs are complex instruments and come with a high risk of losing money rapidly due to leverage. 70% of retail investor accounts lose money when trading CFDs with this provider. You should consider whether you understand how CFDs work and whether you can afford to take the high risk of losing your money.
CFDs are complex instruments and come with a high risk of losing money rapidly due to leverage. 70.41% of retail investor accounts lose money when trading CFDs with this provider. You should consider whether you understand how CFDs work and whether you can afford to take the high risk of losing all your money. Read full risk warning.

Gold - Usd Dollar Analysis

US Session Analysis for CFD Instruments 28/08/2023

Fundamental analysis

28 August, 2023

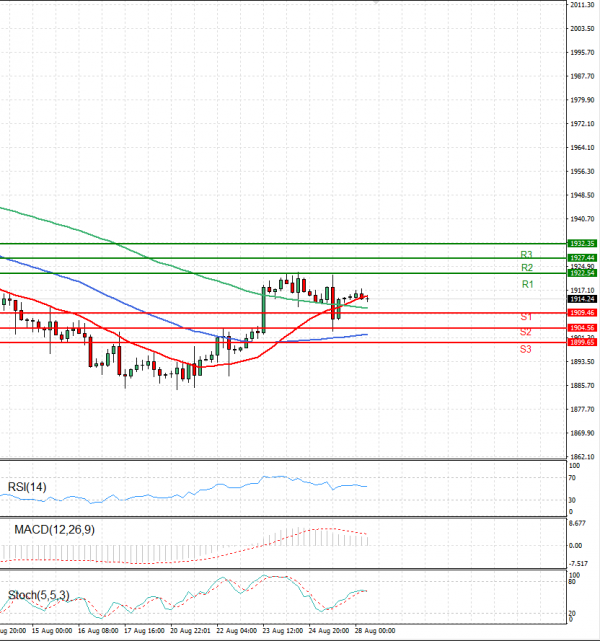
Gold is currently trading at 1,914.00. Gold prices rallied after a rebound from the $1,904-1,903 range late Friday, rising during the opening day of the new week in Asian trading despite a lack of bullish confidence. The XAU/USD rate is currently trading near $1,914, up less than 0.10% on the day and still below the two-week high it hit last Thursday. The US dollar (USD) started the week lower, away from its highest since early June, which is seen as a key factor in gold prices. However, the prospect of further monetary tightening by the US Federal Reserve (Fed) has prevented traders from making aggressive bullish bets on gold's non-yielding price, at least for now. Moreover, the risk stimulus triggered by new measures announced by China over the weekend could further constrain the price of safe-haven gold.

Technical analysis

Gold - Usd Dollar Analysis Technical analysis 28/08/2023
Time Frame: 1 hour

GOLD Support & Resistance Table - 28/08/2023

Support & Resistance Level Explanation
Resistance 2 1927.44 Daily R2
Resistance 1 1922.54 Daily R1
Support 1 1909.46 Daily S1
Support 2 1904.56 Daily S2

GOLD Indicator Table - 28/08/2023

Indicator Signal
SMA 20 Sell
SMA 50 Buy
SMA 100 Buy
MACD( 12;26;9) Buy
RSI (14) Neutral
Stochastic ( 9;6;3) Neutral

GOLD Indicator / Period Table - 28/08/2023

Indicator / Period Day - BuyWeek - SellMonth - Buy
MACD( 12;26;9) Buy BuyBuy
RSI (14) Neutral SellBuy
SMA 20 Sell SellBuy

GOLD 28/08/2023 - Reference Price : 1914.24

Buy
Simple Moving AverageBuy (2)Sell (1)
Technical Indicators - OscillatorsBuy (1)Sell (0)
Share It With Your Network
GOLD Chart
Update Time: -
Highest
Lowest
1M 5M H D W
Prices are loading..
Ready for trading?Start Now