CFDs are complex instruments and come with a high risk of losing money rapidly due to leverage. 71% of retail investor accounts lose money when trading CFDs with this provider. You should consider whether you understand how CFDs work and whether you can afford to take the high risk of losing your money.
CFDs are complex instruments and come with a high risk of losing money rapidly due to leverage. 70.41% of retail investor accounts lose money when trading CFDs with this provider. You should consider whether you understand how CFDs work and whether you can afford to take the high risk of losing all your money. Read full risk warning.

Gold - Usd Dollar Analysis

US Session Analysis for CFD Instruments 07/09/2023

Fundamental analysis

07 September, 2023

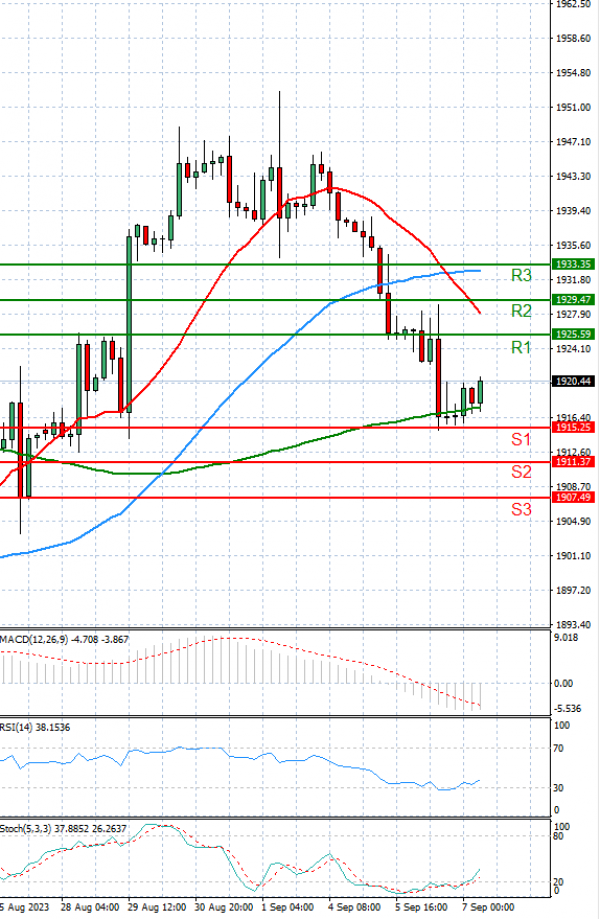
Gold spot and future prices early Thursday morning stand lower at 1,919 and 1,943, respectively.

Gold Price struggles to defend the first daily gains in six at the lowest level in more than a week as market players seek additional clues to defend the previous bearish bias about the bullion. In doing so, the XAU/USD traders reassess the latest United States data and Federal Reserve clues amid hopes of witnessing a soft landing in the US despite higher rates. The same joins fears of economic slowdown in other major countries to propel the Greenback and exert downside pressure on the Gold Price.

Elsewhere, grim concerns about China, one of the world’s biggest Gold customers, join the Sino-American tussles and upbeat yields to also increase the hardships for the XAU/USD recovery.

Technical analysis

Gold - Usd Dollar Analysis Technical analysis 07/09/2023
Time Frame: 1 hour

GOLD Support & Resistance Table - 07/09/2023

Support & Resistance Level Explanation
Resistance 2 1929.47 Daily R2
Resistance 1 1925.59 Daily R1
Support 1 1915.25 Daily S1
Support 2 1911.37 Daily S2

GOLD Indicator Table - 07/09/2023

Indicator Signal
SMA 20 Sell
SMA 50 Sell
SMA 100 Buy
MACD( 12;26;9) Sell
RSI (14) Sell
Stochastic ( 9;6;3) Sell

GOLD Indicator / Period Table - 07/09/2023

Indicator / Period Day - SellWeek - SellMonth - Sell
MACD( 12;26;9) Sell NeutralBuy
RSI (14) Sell SellSell
SMA 20 Sell SellSell

GOLD 07/09/2023 - Reference Price : 1920.42

Sell
Simple Moving AverageBuy (1)Sell (2)
Technical Indicators - OscillatorsBuy (0)Sell (3)
Share It With Your Network
GOLD Chart
Update Time: -
Highest
Lowest
1M 5M H D W
Prices are loading..
Ready for trading?Start Now