Fortrade Canada Ltd. as an order-execution only dealer is not permitted to provide you with any advice or recommendations. These Market Commentaries should not be construed as a recommendation, advice or any attempt by Fortrade Canada Ltd. to prompt or influence you in making an investment decision to purchase, sell, hold or exchange any security or to influence the timing of such activity. This content is produced by Fortrade Limited which is not registered in any capacity with any securities regulatory authority in Canada.
70% of retail investor accounts lose money when trading CFDs with this provider.
CFDs are complex instruments and come with a high risk of losing money rapidly due to leverage. 70% of retail investor accounts lose money when trading CFDs with this provider. You should consider whether you understand how CFDs work and whether you can afford to take the high risk of losing your money.
70.41% of retail investor accounts lose money when trading CFDs with this provider.
CFDs are complex instruments and come with a high risk of losing money rapidly due to leverage. 70.41% of retail investor accounts lose money when trading CFDs with this provider. You should consider whether you understand how CFDs work and whether you can afford to take the high risk of losing all your money. Read full risk warning.
US Session Analysis for CFD Instruments 09/10/2023
Fundamental analysis
09 October, 2023
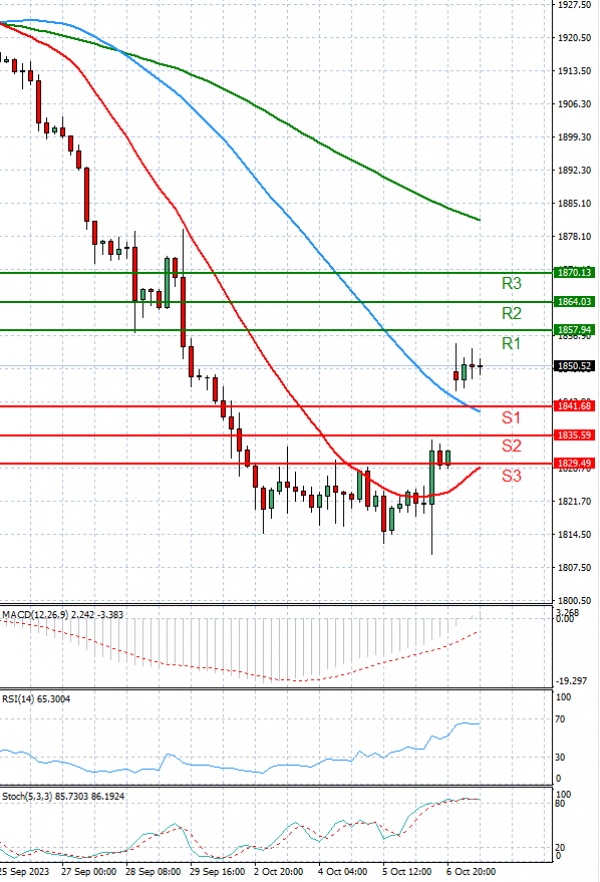
Gold spot price is trading higher today at 1851.8.
Gold price continues to move on an upward trajectory, trading higher around $1,850 per troy ounce during the European session on Monday. The prices of Gold are receiving upward support due to risk aversion, which could be attributed to the Palestine-Israel military conflict.
The ongoing military conflict in the Middle East between Hamas and Israel is being closely watched by the markets. The worry is that the conflict could intensify and extend to other parts of the region, introducing geopolitical uncertainties that might have repercussions on global markets.