CFDs are complex instruments and come with a high risk of losing money rapidly due to leverage. 77% of retail investor accounts lose money when trading CFDs with this provider. You should consider whether you understand how CFDs work and whether you can afford to take the high risk of losing your money.
CFDs are complex instruments and come with a high risk of losing money rapidly due to leverage. 76% of retail investor accounts lose money when trading CFDs with this provider. You should consider whether you can afford to take the high risk of losing your money.

Gold - Usd Dollar Analysis

US Session Analysis for CFD Instruments 28/03/2024

Fundamental analysis

28 March, 2024

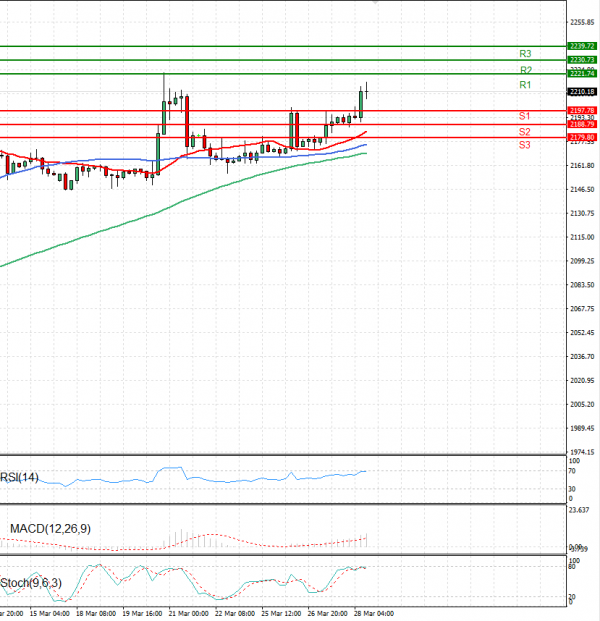
Gold prices are trading higher in today’s European session above 2200 levels.

On Thursday, gold prices surged to highs at $2,210. Currently, there is a 62% likelihood of the initial interest rate reduction occurring in June.

Should the pivot be delayed until the third quarter or if the number of cuts is reduced to two or one, rather than the anticipated three, it will prompt a correction in both silver and gold prices. Especially susceptible to a retreat towards crucial support levels following its consistent ascent is gold.

Following the conclusion of the Fed meeting, the market will shift its attention to forthcoming macroeconomic data. Today, we anticipate the release of US GDP growth figures. If these figures corroborate the preliminary estimates, we can anticipate a substantial downturn compared to recent quarters.

Technical analysis

Gold - Usd Dollar Analysis Technical analysis 28/03/2024
Time Frame: 1 hour

GOLD Support & Resistance Table - 28/03/2024

Support & Resistance Level Explanation
Resistance 2 2230.73 Daily R2
Resistance 1 2221.74 Daily R1
Support 1 2197.78 Daily S1
Support 2 2188.79 Daily S2

GOLD Indicator Table - 28/03/2024

Indicator Signal
SMA 20 Buy
SMA 50 Buy
SMA 100 Buy
MACD( 12;26;9) Buy
RSI (14) Neutral
Stochastic ( 9;6;3) Sell

GOLD Indicator / Period Table - 28/03/2024

Indicator / Period Day - BuyWeek - BuyMonth - Buy
MACD( 12;26;9) Buy BuyBuy
RSI (14) Neutral BuyBuy
SMA 20 Buy BuyBuy

GOLD 28/03/2024 - Reference Price : 2210.18

Buy
Simple Moving AverageBuy (3)Sell (0)
Technical Indicators - OscillatorsBuy (1)Sell (1)
Share It With Your Network
GOLD Chart
Update Time: -
Highest
Lowest
1M 5M H D W
Prices are loading..
Ready for trading?Start Now