CFDs are complex instruments and come with a high risk of losing money rapidly due to leverage. 71% of retail investor accounts lose money when trading CFDs with this provider. You should consider whether you understand how CFDs work and whether you can afford to take the high risk of losing your money.
CFDs are complex instruments and come with a high risk of losing money rapidly due to leverage. 70.91% of retail investor accounts lose money when trading CFDs with this provider. You should consider whether you understand how CFDs work and whether you can afford to take the high risk of losing all your money. Read full risk warning.

Gold - Usd Dollar Analysis

US Session Analysis for CFD Instruments 19/06/2024

Fundamental analysis

19 June, 2024

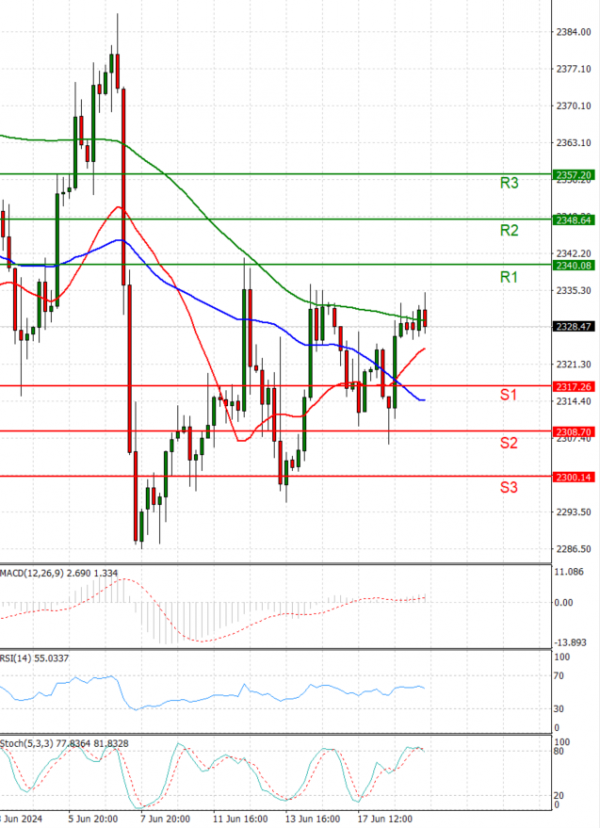
Gold prices are trading in today’s European session below 2330 levels.

Gold prices struggled to build on the previous day's rebound near the $2,300 mark, fluctuating within a narrow range during the European session on Wednesday.

The precious metal has been confined to this range for the past week and a half as traders await clarity on when the Federal Reserve (Fed) might start cutting interest rates.

Although the Fed took a more hawkish stance in June, forecasting only one rate cut this year, the market is still anticipating two cuts in 2024 due to signs of easing inflation.

Additionally, weaker U.S. Retail Sales data released on Tuesday suggested waning consumer strength, increasing bets for Fed rate cuts in September and December.

Technical analysis

Gold - Usd Dollar Analysis Technical analysis 19/06/2024
Time Frame: 1 hour

GOLD Support & Resistance Table - 19/06/2024

Support & Resistance Level Explanation
Resistance 2 2348.64 Daily R2
Resistance 1 2340.08 Daily R1
Support 1 2317.26 Daily S1
Support 2 2308.70 Daily S2

GOLD Indicator Table - 19/06/2024

Indicator Signal
SMA 20 Buy
SMA 50 Buy
SMA 100 Sell
MACD( 12;26;9) Buy
RSI (14) Buy
Stochastic ( 9;6;3) Buy

GOLD Indicator / Period Table - 19/06/2024

Indicator / Period Day - BuyWeek - SellMonth - Buy
MACD( 12;26;9) Buy SellBuy
RSI (14) Buy SellBuy
SMA 20 Buy NeutralBuy

GOLD 19/06/2024 - Reference Price : 2328.67

Buy
Simple Moving AverageBuy (2)Sell (1)
Technical Indicators - OscillatorsBuy (3)Sell (0)
Share It With Your Network
GOLD Chart
Update Time: -
Highest
Lowest
1M 5M H D W
Prices are loading..
Ready for trading?Start Now