CFDs are complex instruments and come with a high risk of losing money rapidly due to leverage. 71% of retail investor accounts lose money when trading CFDs with this provider. You should consider whether you understand how CFDs work and whether you can afford to take the high risk of losing your money.
CFDs are complex instruments and come with a high risk of losing money rapidly due to leverage. 70.91% of retail investor accounts lose money when trading CFDs with this provider. You should consider whether you understand how CFDs work and whether you can afford to take the high risk of losing all your money. Read full risk warning.

Gold - Usd Dollar Analysis

US Session Analysis for CFD Instruments 20/06/2024

Fundamental analysis

20 June, 2024

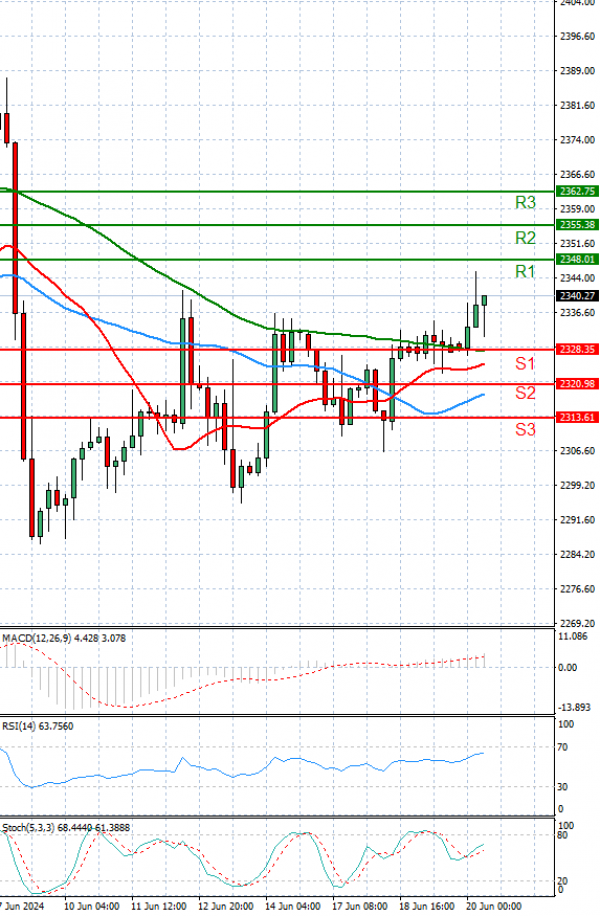
Gold prices are trading in today’s European session around 2330 levels.

On Thursday, gold prices awakened from their slumber, rising a lively half a percent to trade in the $2,340s before falling just below this level. The precious metal is at a critical technical juncture that could shape its trend for the rest of the summer.

Safe-haven demand for gold increases as investors worry about escalating geopolitical tensions.

In the Middle East, tensions between Israel and Lebanon peaked on Wednesday after Israeli officials announced plans for the Northern Command to launch an "all-out war" with Hezbollah in Lebanon.

Technical analysis

Gold - Usd Dollar Analysis Technical analysis 20/06/2024
Time Frame: 1 hour

GOLD Support & Resistance Table - 20/06/2024

Support & Resistance Level Explanation
Resistance 2 2355.38 Daily R2
Resistance 1 2348.01 Daily R1
Support 1 2328.35 Daily S1
Support 2 2320.98 Daily S2

GOLD Indicator Table - 20/06/2024

Indicator Signal
SMA 20 Buy
SMA 50 Buy
SMA 100 Buy
MACD( 12;26;9) Buy
RSI (14) Buy
Stochastic ( 9;6;3) Buy

GOLD Indicator / Period Table - 20/06/2024

Indicator / Period Day - BuyWeek - BuyMonth - Buy
MACD( 12;26;9) Buy SellBuy
RSI (14) Buy BuyBuy
SMA 20 Buy BuyBuy

GOLD 20/06/2024 - Reference Price : 2338.18

Buy
Simple Moving AverageBuy (3)Sell (0)
Technical Indicators - OscillatorsBuy (3)Sell (0)
Share It With Your Network
GOLD Chart
Update Time: -
Highest
Lowest
1M 5M H D W
Prices are loading..
Ready for trading?Start Now