Fortrade Canada Ltd. as an order-execution only dealer is not permitted to provide you with any advice or recommendations. These Market Commentaries should not be construed as a recommendation, advice or any attempt by Fortrade Canada Ltd. to prompt or influence you in making an investment decision to purchase, sell, hold or exchange any security or to influence the timing of such activity. This content is produced by Fortrade Limited which is not registered in any capacity with any securities regulatory authority in Canada.
69% of retail investor accounts lose money when trading CFDs with this provider.
CFDs are complex instruments and come with a high risk of losing money rapidly due to leverage. 69% of retail investor accounts lose money when trading CFDs with this provider. You should consider whether you understand how CFDs work and whether you can afford to take the high risk of losing your money.
70.88% of retail investor accounts lose money when trading CFDs with this provider.
CFDs are complex instruments and come with a high risk of losing money rapidly due to leverage. 70.88% of retail investor accounts lose money when trading CFDs with this provider. You should consider whether you understand how CFDs work and whether you can afford to take the high risk of losing all your money. Read full risk warning.
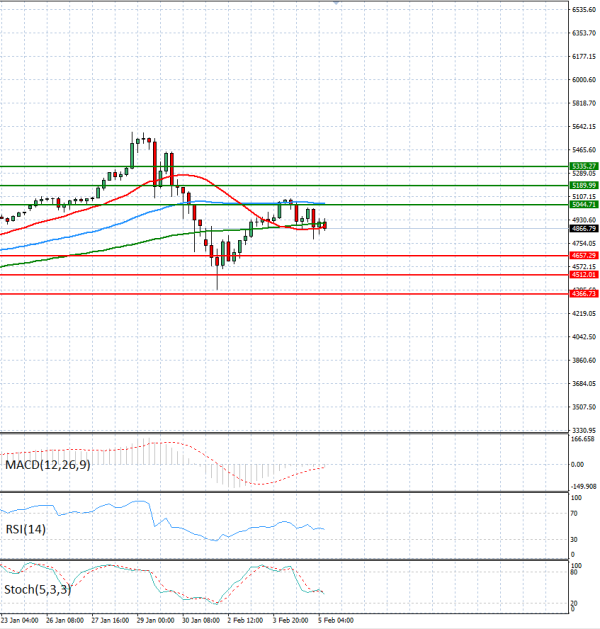
US Session Analysis for CFD Instruments 05/02/2026
Fundamental analysis
05 February, 2026
Gold prices are trading in today’s European session below 4900 levels.
Gold continued to fall by around -2% to below $5,900 in the European session, slowing down its recovery from the steepest price correction in almost a decade. This pressure is mainly due to a strengthening US dollar, and easing geopolitical tensions between the United States and China, following a positive call between President Trump and President Xi . However, given the high tensions in the middle east, and the fact that major banks have left their near term price targets unchanged, this indicates that gold prices are more likely than not to continue recovering.