CFDs are complex instruments and come with a high risk of losing money rapidly due to leverage. 77% of retail investor accounts lose money when trading CFDs with this provider. You should consider whether you understand how CFDs work and whether you can afford to take the high risk of losing your money.
CFDs are complex instruments and come with a high risk of losing money rapidly due to leverage. 76% of retail investor accounts lose money when trading CFDs with this provider. You should consider whether you can afford to take the high risk of losing your money.

USA500 Analysis

US Session Analysis for CFD Instruments 07/05/2024

Fundamental analysis

07 May, 2024

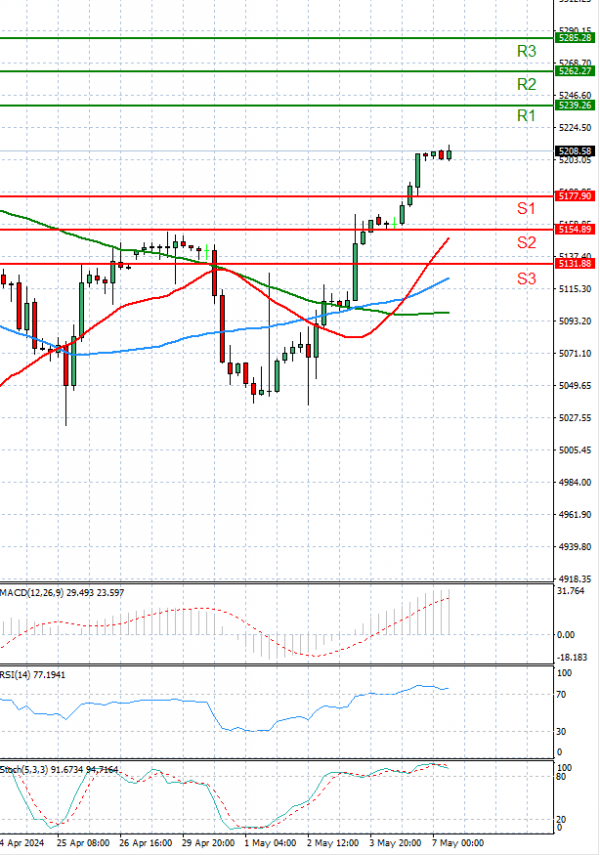
The USA500 is currently trading above 5,100 levels.

On Tuesday, U.S. stock futures showed limited movement, following a surge in equities during the previous session, driven by optimism about potential Federal Reserve interest rate cuts later in the year.

Richmond Fed President Thomas Barkin remarked that current borrowing costs are sufficiently "restrictive" to manage heightened inflation concerns.

Walt Disney prepares to disclose its first quarterly results following its victory in a contentious proxy battle with activist investors.

The Dow futures contract saw a modest increase of 46 points or 0.1%, S&P 500 futures remained largely unchanged, and Nasdaq 100 futures dipped slightly by 10 points or 0.1%.

Technical analysis

USA500 Analysis Technical analysis 07/05/2024
Time Frame: 1 hour

USA500 Support & Resistance Table - 07/05/2024

Support & Resistance Level Explanation
Resistance 2 5262.27 Daily R2
Resistance 1 5239.26 Daily R1
Support 1 5177.90 Daily S1
Support 2 5154.89 Daily S2

USA500 Indicator Table - 07/05/2024

Indicator Signal
SMA 20 Buy
SMA 50 Buy
SMA 100 Buy
MACD( 12;26;9) Buy
RSI (14) Buy
Stochastic ( 9;6;3) Buy

USA500 Indicator / Period Table - 07/05/2024

Indicator / Period Day - BuyWeek - BuyMonth - Buy
MACD( 12;26;9) Buy BuyBuy
RSI (14) Buy BuyBuy
SMA 20 Buy BuyBuy

USA500 07/05/2024 - Reference Price : 5208.58

Buy
Simple Moving AverageBuy (3)Sell (0)
Technical Indicators - OscillatorsBuy (3)Sell (0)
Share It With Your Network
USA500 Chart
Update Time: -
Highest
Lowest
1M 5M H D W
Prices are loading..
Ready for trading?Start Now