CFDs are complex instruments and come with a high risk of losing money rapidly due to leverage. 77% of retail investor accounts lose money when trading CFDs with this provider. You should consider whether you understand how CFDs work and whether you can afford to take the high risk of losing your money.
CFDs are complex instruments and come with a high risk of losing money rapidly due to leverage. 76% of retail investor accounts lose money when trading CFDs with this provider. You should consider whether you can afford to take the high risk of losing your money.

USA500 Analysis

US Session Analysis for CFD Instruments 10/05/2024

Fundamental analysis

10 May, 2024

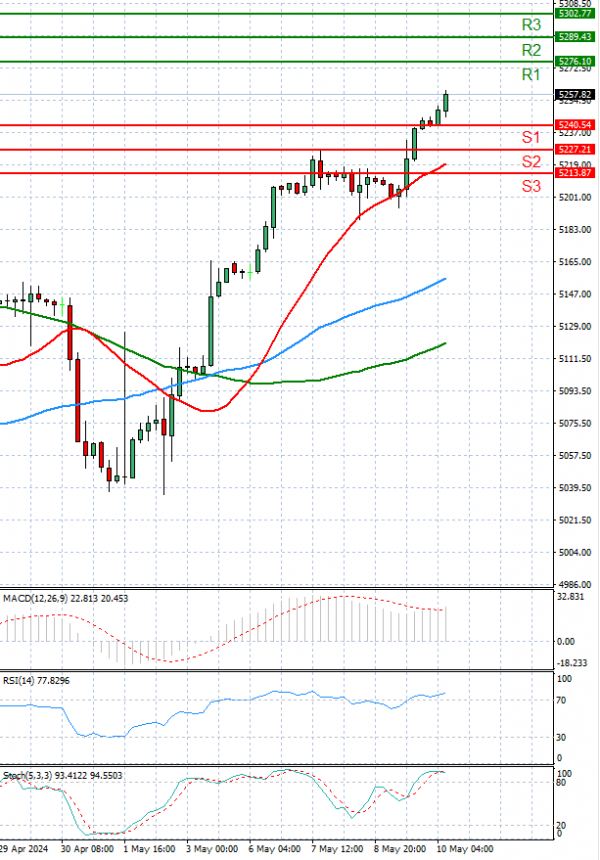
The USA500 is currently trading above 5,200 levels.

On Friday, U.S. stock futures ascended as investors shifted focus towards an upcoming pivotal inflation report and evaluated a slew of corporate earnings. The S&P 500 futures had climbed 11 points or 0.2%, Nasdaq 100 futures had inched up by 48 points or 0.3%, and Dow futures had advanced by 79 points or 0.2%.

On Thursday, the 30-stock Dow Jones Industrial Average continued its streak of positive sessions, buoyed by a better-than-expected reading of weekly U.S. jobless claims. This figure served as the latest indication of a potential easing in the American labour market, reinforcing speculation that the Federal Reserve might commence scaling back interest rates from their highest point in over two decades as early as September.

The Dow closed the day at its highest level since April 1, with both the benchmark S&P 500 and the tech-focused Nasdaq Composite also making gains.

Technical analysis

USA500 Analysis Technical analysis 10/05/2024
Time Frame: 1 hour

USA500 Support & Resistance Table - 10/05/2024

Support & Resistance Level Explanation
Resistance 2 5289.43 Daily R2
Resistance 1 5276.10 Daily R1
Support 1 5240.54 Daily S1
Support 2 5227.21 Daily S2

USA500 Indicator Table - 10/05/2024

Indicator Signal
SMA 20 Buy
SMA 50 Buy
SMA 100 Buy
MACD( 12;26;9) Buy
RSI (14) Buy
Stochastic ( 9;6;3) Buy

USA500 Indicator / Period Table - 10/05/2024

Indicator / Period Day - BuyWeek - BuyMonth - Buy
MACD( 12;26;9) Buy SellBuy
RSI (14) Buy BuyBuy
SMA 20 Buy BuyBuy

USA500 10/05/2024 - Reference Price : 5258.32

Buy
Simple Moving AverageBuy (3)Sell (0)
Technical Indicators - OscillatorsBuy (3)Sell (0)
Share It With Your Network
USA500 Chart
Update Time: -
Highest
Lowest
1M 5M H D W
Prices are loading..
Ready for trading?Start Now