CFDs are complex instruments and come with a high risk of losing money rapidly due to leverage. 77% of retail investor accounts lose money when trading CFDs with this provider. You should consider whether you understand how CFDs work and whether you can afford to take the high risk of losing your money.
CFDs are complex instruments and come with a high risk of losing money rapidly due to leverage. 76% of retail investor accounts lose money when trading CFDs with this provider. You should consider whether you can afford to take the high risk of losing your money.

USA500 Analysis

US Session Analysis for CFD Instruments 26/04/2024

Fundamental analysis

26 April, 2024

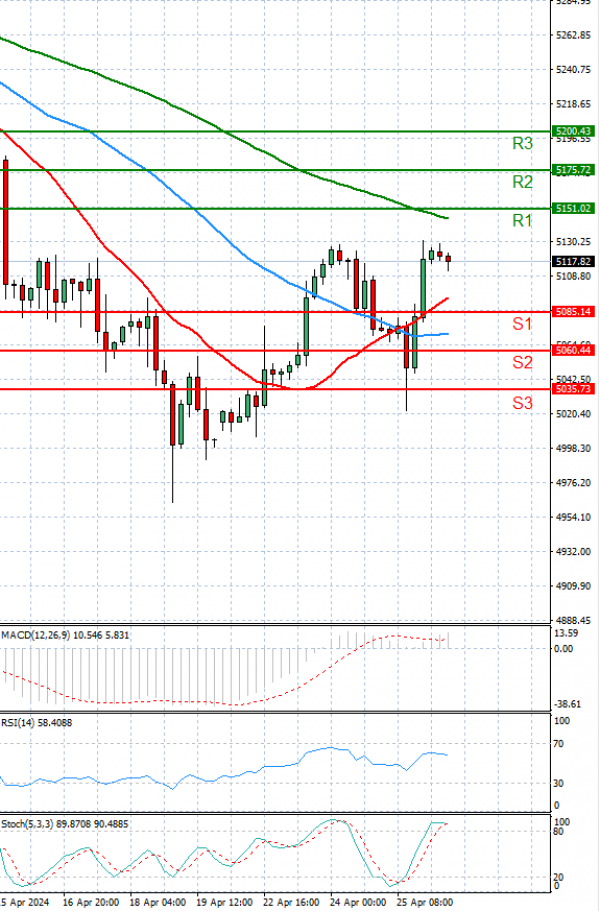
The USA500 is currently trading above 5,000 levels.

On Friday, stock futures in New York edged higher as traders absorbed earnings reports from major technology firms and anticipated the release of crucial U.S. inflation figures.

Dow futures had gained 48 points or 0.1%, S&P 500 futures had climbed 39 points or 0.8%, and Nasdaq 100 futures had advanced 188 points or 1.1%.

In the previous session, the primary indices on Wall Street closed lower, influenced by an unexpectedly soft reading of U.S. economic growth in the first quarter. This, combined with indications of persistently elevated inflation, tempered optimism regarding potential interest rate cuts by the Federal Reserve later this year.

Technical analysis

USA500 Analysis Technical analysis 26/04/2024
Time Frame: 1 hour

USA500 Support & Resistance Table - 26/04/2024

Support & Resistance Level Explanation
Resistance 2 5175.72 Daily R2
Resistance 1 5151.02 Daily R1
Support 1 5085.14 Daily S1
Support 2 5060.44 Daily S2

USA500 Indicator Table - 26/04/2024

Indicator Signal
SMA 20 Buy
SMA 50 Buy
SMA 100 Sell
MACD( 12;26;9) Buy
RSI (14) Buy
Stochastic ( 9;6;3) Buy

USA500 Indicator / Period Table - 26/04/2024

Indicator / Period Day - BuyWeek - SellMonth - Buy
MACD( 12;26;9) Buy SellBuy
RSI (14) Buy SellBuy
SMA 20 Buy SellBuy

USA500 26/04/2024 - Reference Price : 5118.08

Buy
Simple Moving AverageBuy (2)Sell (1)
Technical Indicators - OscillatorsBuy (3)Sell (0)
Share It With Your Network
USA500 Chart
Update Time: -
Highest
Lowest
1M 5M H D W
Prices are loading..
Ready for trading?Start Now