Fortrade Canada Ltd. as an order-execution only dealer is not permitted to provide you with any advice or recommendations. These Market Commentaries should not be construed as a recommendation, advice or any attempt by Fortrade Canada Ltd. to prompt or influence you in making an investment decision to purchase, sell, hold or exchange any security or to influence the timing of such activity. This content is produced by Fortrade Limited which is not registered in any capacity with any securities regulatory authority in Canada.
69% of retail investor accounts lose money when trading CFDs with this provider.
CFDs are complex instruments and come with a high risk of losing money rapidly due to leverage. 69% of retail investor accounts lose money when trading CFDs with this provider. You should consider whether you understand how CFDs work and whether you can afford to take the high risk of losing your money.
70.88% of retail investor accounts lose money when trading CFDs with this provider.
CFDs are complex instruments and come with a high risk of losing money rapidly due to leverage. 70.88% of retail investor accounts lose money when trading CFDs with this provider. You should consider whether you understand how CFDs work and whether you can afford to take the high risk of losing all your money. Read full risk warning.
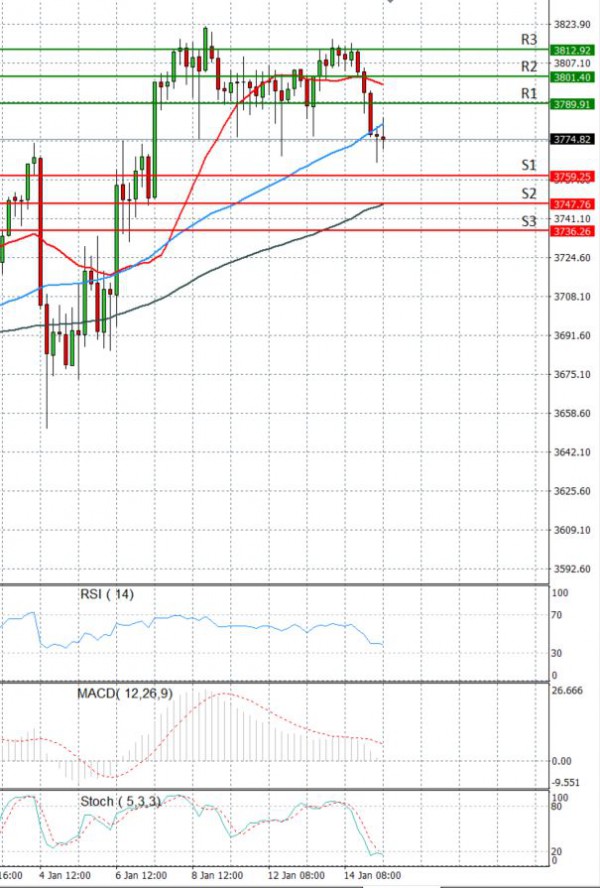
US Session Analysis for CFD Instruments 15/01/2021
Fundamental analysis
15 January, 2021
U.S. stock index futures slipped on Friday as optimism over a $1.9 trillion stimulus plan unveiled by incoming President Joe Biden faded with investors turning to quarterly reports from major Wall Street banks. JPMorgan Chase and Citigroup Inc will unofficially kickoff the fourth-quarter earnings season before the bell and investors will focus on their outlooks to validate expectations for a strong 2021 rebound in earnings and the economy. Earnings for S&P 500 companies are expected to decline 9.5% in the final quarter of 2020 from a year ago, but are expected to rebound in 2021, with a gain of 16.4% projected for the first quarter, according to IBES data from Refinitiv.