Fortrade Canada Ltd. as an order-execution only dealer is not permitted to provide you with any advice or recommendations. These Market Commentaries should not be construed as a recommendation, advice or any attempt by Fortrade Canada Ltd. to prompt or influence you in making an investment decision to purchase, sell, hold or exchange any security or to influence the timing of such activity. This content is produced by Fortrade Limited which is not registered in any capacity with any securities regulatory authority in Canada.
69% of retail investor accounts lose money when trading CFDs with this provider.
CFDs are complex instruments and come with a high risk of losing money rapidly due to leverage. 69% of retail investor accounts lose money when trading CFDs with this provider. You should consider whether you understand how CFDs work and whether you can afford to take the high risk of losing your money.
67.52% of retail investor accounts lose money when trading CFDs with this provider.
CFDs are complex instruments and come with a high risk of losing money rapidly due to leverage. 67.52% of retail investor accounts lose money when trading CFDs with this provider. You should consider whether you understand how CFDs work and whether you can afford to take the high risk of losing all your money. Read full risk warning.
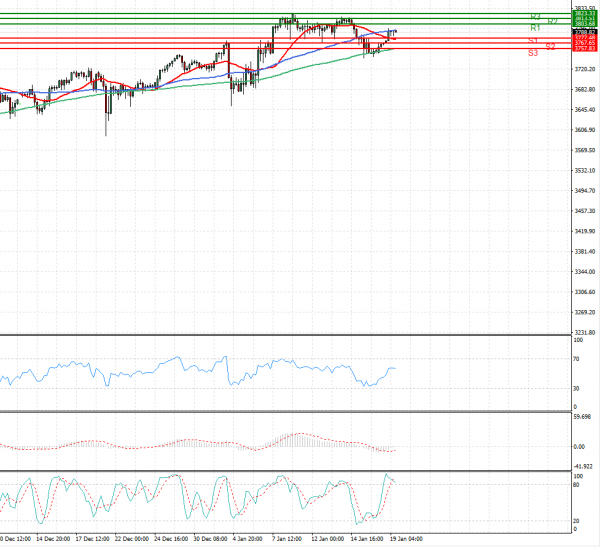
US Session Analysis for CFD Instruments 19/01/2021
Fundamental analysis
19 January, 2021
U.S. stock futures climbed ahead of a slew of earnings releases and testimony by Janet Yellen in which she is expected to support higher coronavirus relief spending. Futures tied to the S&P 500 rose 0.8%, pointing to a rally after the opening bell. Those linked to the Nasdaq-100 added 1%, suggesting gains in tech stocks. Earnings season kicks into high gear Tuesday, with Goldman Sachs and Bank of America releasing their results before markets open. Netflix is expected to report after hours. Ms. Yellen is scheduled to speak before the Senate Finance Committee at 10 a.m. ET, which will vote on her nomination for Treasury Secretary. According to a copy of her prepared remarks, she will tell lawmakers that the U.S. risks a longer, more painful recession unless Congress approves more aid, and to encourage them to “act big” to shore up the recovery.