Fortrade Canada Ltd. as an order-execution only dealer is not permitted to provide you with any advice or recommendations. These Market Commentaries should not be construed as a recommendation, advice or any attempt by Fortrade Canada Ltd. to prompt or influence you in making an investment decision to purchase, sell, hold or exchange any security or to influence the timing of such activity. This content is produced by Fortrade Limited which is not registered in any capacity with any securities regulatory authority in Canada.
71% of retail investor accounts lose money when trading CFDs with this provider.
CFDs are complex instruments and come with a high risk of losing money rapidly due to leverage. 71% of retail investor accounts lose money when trading CFDs with this provider. You should consider whether you understand how CFDs work and whether you can afford to take the high risk of losing your money.
70.91% of retail investor accounts lose money when trading CFDs with this provider.
CFDs are complex instruments and come with a high risk of losing money rapidly due to leverage. 70.91% of retail investor accounts lose money when trading CFDs with this provider. You should consider whether you understand how CFDs work and whether you can afford to take the high risk of losing all your money. Read full risk warning.
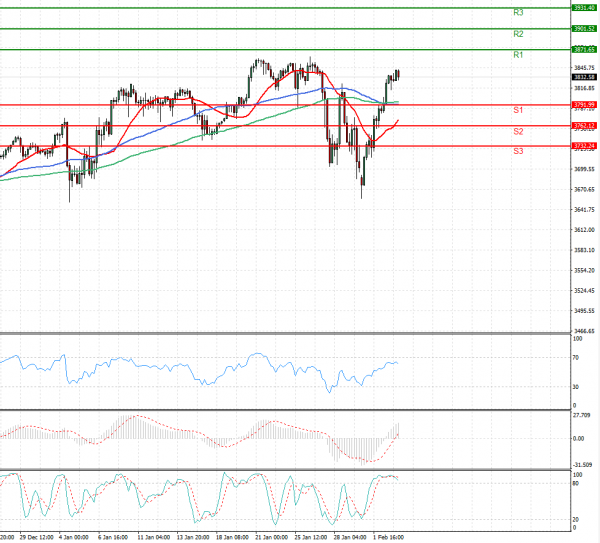
US Session Analysis for CFD Instruments 03/02/2021
Fundamental analysis
03 February, 2021
U.S. stock futures rose on Wednesday, after a strong market rally as the Reddit trading mania appeared to re-appear Dow futures pointed to an opening gain of about 60 points. S&P 500 futures and Nasdaq 100 futures also both traded in positive territory. Strong earnings from Amazon and Alphabet helped futures. Amazon reported earnings nearly doubled Wall Street estimates; however, the stock move was tempered by news that Jeff Bezos was stepping down as CEO. Amazon’s stock edged 0.3% higher in after-hours trading. Shares of Alphabet surged more than 7% in after-hours trading after the technology giant reported 23% revenue growth and topped estimates for earnings.