Fortrade Canada Ltd. as an order-execution only dealer is not permitted to provide you with any advice or recommendations. These Market Commentaries should not be construed as a recommendation, advice or any attempt by Fortrade Canada Ltd. to prompt or influence you in making an investment decision to purchase, sell, hold or exchange any security or to influence the timing of such activity. This content is produced by Fortrade Limited which is not registered in any capacity with any securities regulatory authority in Canada.
69% of retail investor accounts lose money when trading CFDs with this provider.
CFDs are complex instruments and come with a high risk of losing money rapidly due to leverage. 69% of retail investor accounts lose money when trading CFDs with this provider. You should consider whether you understand how CFDs work and whether you can afford to take the high risk of losing your money.
67.52% of retail investor accounts lose money when trading CFDs with this provider.
CFDs are complex instruments and come with a high risk of losing money rapidly due to leverage. 67.52% of retail investor accounts lose money when trading CFDs with this provider. You should consider whether you understand how CFDs work and whether you can afford to take the high risk of losing all your money. Read full risk warning.
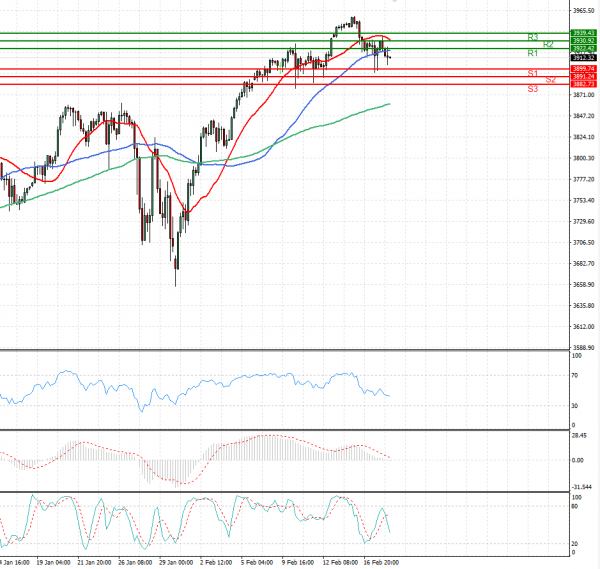
US Session Analysis for CFD Instruments 18/02/2021
Fundamental analysis
18 February, 2021
Stock futures slipped Thursday, signaling declines for major indexes as investors awaited earnings from several major companies and fresh data on the U.S. labor market. Futures on the S&P 500 edged down 0.5%. Contracts for the technology-heavy Nasdaq-100 fell 0.8%, pointing to fresh losses after a volatile day for tech stocks on Wednesday. Stocks have taken a breather in recent sessions after powering higher for much of 2021. Some investors have been caught off guard by a quick rise in government-bond yields, which appeared to knock technology stocks that have benefited from years of low interest rates. Money managers are also concerned about lofty valuations.