Fortrade Canada Ltd. as an order-execution only dealer is not permitted to provide you with any advice or recommendations. These Market Commentaries should not be construed as a recommendation, advice or any attempt by Fortrade Canada Ltd. to prompt or influence you in making an investment decision to purchase, sell, hold or exchange any security or to influence the timing of such activity. This content is produced by Fortrade Limited which is not registered in any capacity with any securities regulatory authority in Canada.
71% of retail investor accounts lose money when trading CFDs with this provider.
CFDs are complex instruments and come with a high risk of losing money rapidly due to leverage. 71% of retail investor accounts lose money when trading CFDs with this provider. You should consider whether you understand how CFDs work and whether you can afford to take the high risk of losing your money.
70.91% of retail investor accounts lose money when trading CFDs with this provider.
CFDs are complex instruments and come with a high risk of losing money rapidly due to leverage. 70.91% of retail investor accounts lose money when trading CFDs with this provider. You should consider whether you understand how CFDs work and whether you can afford to take the high risk of losing all your money. Read full risk warning.
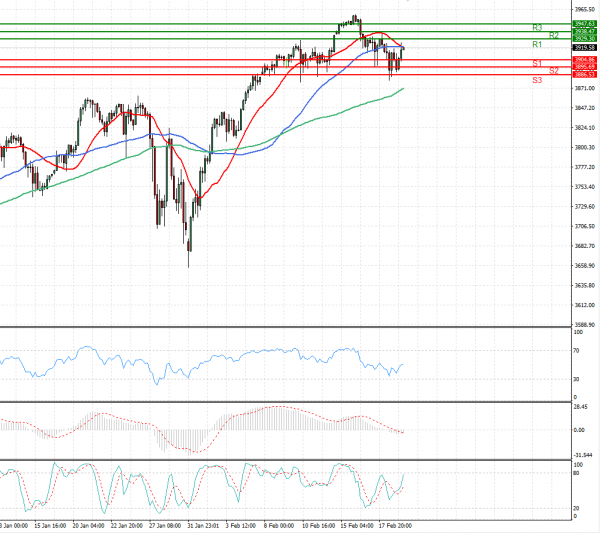
US Session Analysis for CFD Instruments 19/02/2021
Fundamental analysis
19 February, 2021
US stock futures pointed to a slightly higher open on Friday after a week in which equities struggled for direction as bond yields rose, increasing borrowing costs and worrying some investors. USA 500 futures rose 0.31% on Friday morning, after the benchmark index fell 0.44% on Thursday. Equities have had a subdued week after jumping in early February. Lawmakers continue to debate a possible $1.9 trillion stimulus package in the US and chew over economic data. On Thursday, data showed US jobless claims rose more than expected to 861,000 the previous week, contrasting with stronger-than-predicted retail sales figures from the day earlier.