Fortrade Canada Ltd. as an order-execution only dealer is not permitted to provide you with any advice or recommendations. These Market Commentaries should not be construed as a recommendation, advice or any attempt by Fortrade Canada Ltd. to prompt or influence you in making an investment decision to purchase, sell, hold or exchange any security or to influence the timing of such activity. This content is produced by Fortrade Limited which is not registered in any capacity with any securities regulatory authority in Canada.
71% of retail investor accounts lose money when trading CFDs with this provider.
CFDs are complex instruments and come with a high risk of losing money rapidly due to leverage. 71% of retail investor accounts lose money when trading CFDs with this provider. You should consider whether you understand how CFDs work and whether you can afford to take the high risk of losing your money.
70.41% of retail investor accounts lose money when trading CFDs with this provider.
CFDs are complex instruments and come with a high risk of losing money rapidly due to leverage. 70.41% of retail investor accounts lose money when trading CFDs with this provider. You should consider whether you understand how CFDs work and whether you can afford to take the high risk of losing all your money. Read full risk warning.
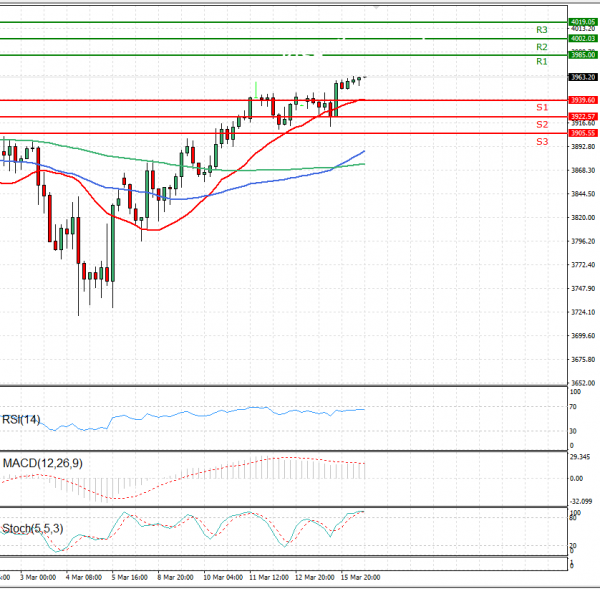
US Session Analysis for CFD Instruments 16/03/2021
Fundamental analysis
16 March, 2021
U.S. stock futures wobbled Tuesday ahead of data on consumer spending and industrial activity that will give investors fresh insights into the pace of the economic recovery. Futures tied to the S&P 500 and the Dow Jones Industrial Average were relatively flat. Both major indexes closed at record highs on Monday. Contracts for the technology-focused Nasdaq-100 gained 0.6%, suggesting the tech sector could extend its rebound when the stock market opens. Tech stocks have steadied in recent sessions after taking a tumble when bond yields shot up in late February and early March. Investors are grappling with the implications of a big wave of government spending and the relaxation of lockdowns on the economy. Investors’ concerns that a surge of growth and inflation could prompt the Federal Reserve to boost interest rates earlier than expected dented shares of tech companies that had benefited from low bond yields. Rate-setters at the central bank are gathering for a two-day policy meeting starting Tuesday.