Fortrade Canada Ltd. as an order-execution only dealer is not permitted to provide you with any advice or recommendations. These Market Commentaries should not be construed as a recommendation, advice or any attempt by Fortrade Canada Ltd. to prompt or influence you in making an investment decision to purchase, sell, hold or exchange any security or to influence the timing of such activity. This content is produced by Fortrade Limited which is not registered in any capacity with any securities regulatory authority in Canada.
71% of retail investor accounts lose money when trading CFDs with this provider.
CFDs are complex instruments and come with a high risk of losing money rapidly due to leverage. 71% of retail investor accounts lose money when trading CFDs with this provider. You should consider whether you understand how CFDs work and whether you can afford to take the high risk of losing your money.
70.41% of retail investor accounts lose money when trading CFDs with this provider.
CFDs are complex instruments and come with a high risk of losing money rapidly due to leverage. 70.41% of retail investor accounts lose money when trading CFDs with this provider. You should consider whether you understand how CFDs work and whether you can afford to take the high risk of losing all your money. Read full risk warning.
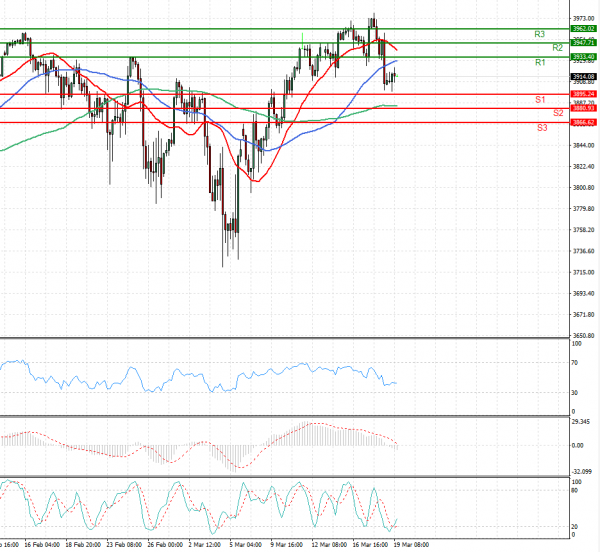
US Session Analysis for CFD Instruments 19/03/2021
Fundamental analysis
19 March, 2021
U.S. stock futures ticked higher Friday, with technology stocks poised to lead the rebound, as bond markets calmed and the 10-year Treasury yield eased down from a 14-month high. USA 500 futures edged up 0.4%, leaving the broad-market index on track for a tepid drop this week. The gauge closed down 1.5% on Thursday. The major indexes have been choppy this week, buffeted by brightening economic prospects on one hand, and bond investors’ worry that interest rates will climb sooner than anticipated on the other hand. Investors are betting that inflation will rise as growth picks up, and remain elevated long enough to force the Federal Reserve to tighten monetary policy. Those concerns led to a sharp selloff in the government bond market on Thursday, and spurred investors to exit tech and other high-growth stocks.