Fortrade Canada Ltd. as an order-execution only dealer is not permitted to provide you with any advice or recommendations. These Market Commentaries should not be construed as a recommendation, advice or any attempt by Fortrade Canada Ltd. to prompt or influence you in making an investment decision to purchase, sell, hold or exchange any security or to influence the timing of such activity. This content is produced by Fortrade Limited which is not registered in any capacity with any securities regulatory authority in Canada.
71% of retail investor accounts lose money when trading CFDs with this provider.
CFDs are complex instruments and come with a high risk of losing money rapidly due to leverage. 71% of retail investor accounts lose money when trading CFDs with this provider. You should consider whether you understand how CFDs work and whether you can afford to take the high risk of losing your money.
70.91% of retail investor accounts lose money when trading CFDs with this provider.
CFDs are complex instruments and come with a high risk of losing money rapidly due to leverage. 70.91% of retail investor accounts lose money when trading CFDs with this provider. You should consider whether you understand how CFDs work and whether you can afford to take the high risk of losing all your money. Read full risk warning.
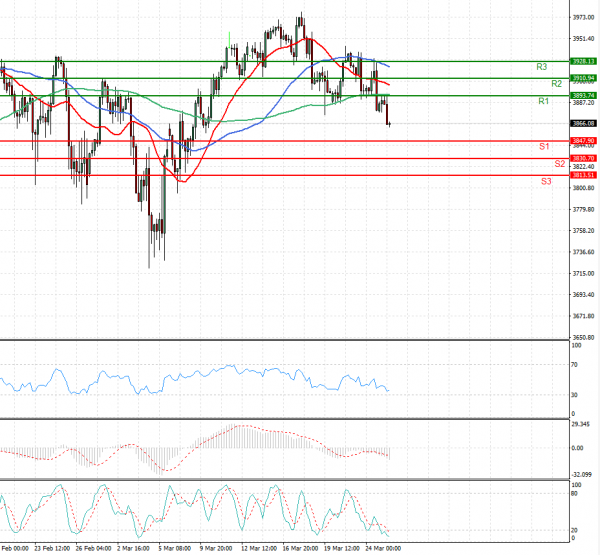
US Session Analysis for CFD Instruments 25/03/2021
Fundamental analysis
25 March, 2021
U.S. stock futures edged higher Thursday ahead of data that will offer fresh cues on the pace of recovery in the labor market. S&P 500 futures ticked 0.2% higher, a day after the broad market gauge was dragged lower by technology stocks. Nasdaq-100 futures edged up 0.3%, indicating that technology stocks may recover some ground. The benchmark retreated almost 1.7% on Wednesday. Contracts tied to the Dow Jones Industrial Average ticked up 0.2%. Investors’ optimism has been muted in recent days by mixed signals from different parts of the economy. The government’s Covid-19 relief spending and the rollout of vaccines is helping spur economic growth. That has led to a surge in consumers’ demand for products. But there are signs that the global rebound may be slowed by an extension of Covid-19 lockdowns and growing constraints in the supply chain for crucial products such as vaccines and electronic chips.