Fortrade Canada Ltd. as an order-execution only dealer is not permitted to provide you with any advice or recommendations. These Market Commentaries should not be construed as a recommendation, advice or any attempt by Fortrade Canada Ltd. to prompt or influence you in making an investment decision to purchase, sell, hold or exchange any security or to influence the timing of such activity. This content is produced by Fortrade Limited which is not registered in any capacity with any securities regulatory authority in Canada.
71% of retail investor accounts lose money when trading CFDs with this provider.
CFDs are complex instruments and come with a high risk of losing money rapidly due to leverage. 71% of retail investor accounts lose money when trading CFDs with this provider. You should consider whether you understand how CFDs work and whether you can afford to take the high risk of losing your money.
70.91% of retail investor accounts lose money when trading CFDs with this provider.
CFDs are complex instruments and come with a high risk of losing money rapidly due to leverage. 70.91% of retail investor accounts lose money when trading CFDs with this provider. You should consider whether you understand how CFDs work and whether you can afford to take the high risk of losing all your money. Read full risk warning.
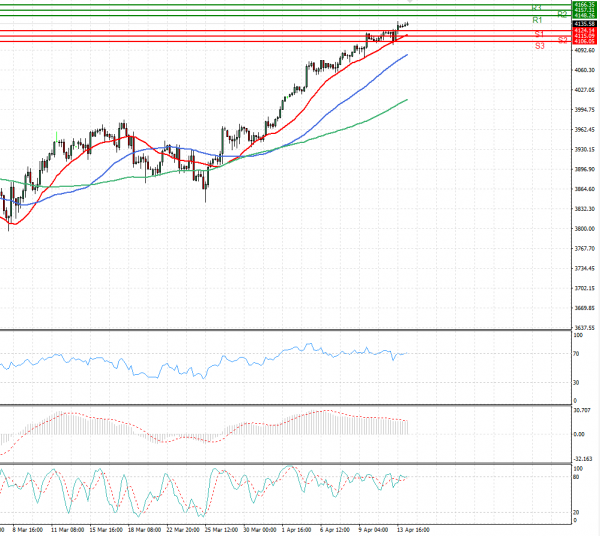
US Session Analysis for CFD Instruments 14/04/2021
Fundamental analysis
14 April, 2021
U.S. stock futures paused Wednesday as investors awaited corporate earnings from some of the nation’s biggest banks and a speech from Federal Reserve Chairman Jerome Powell. Futures tied to the broad S&P 500 index edged up 0.1%. On Tuesday, the benchmark hit its 21st record close of the year, led higher by technology shares. Nasdaq-100 futures also ticked 0.1% higher. Investors say they are optimistic about the biggest American companies’ earnings and outlook for the rest of the year, given the projections for a sharp economic recovery. Sizable government stimulus measures and repeated pledges from the Federal Reserve to continue supporting the recovery have largely helped alleviate concerns about the pace of the reopening and the vaccination rollout.