Fortrade Canada Ltd. as an order-execution only dealer is not permitted to provide you with any advice or recommendations. These Market Commentaries should not be construed as a recommendation, advice or any attempt by Fortrade Canada Ltd. to prompt or influence you in making an investment decision to purchase, sell, hold or exchange any security or to influence the timing of such activity. This content is produced by Fortrade Limited which is not registered in any capacity with any securities regulatory authority in Canada.
71% of retail investor accounts lose money when trading CFDs with this provider.
CFDs are complex instruments and come with a high risk of losing money rapidly due to leverage. 71% of retail investor accounts lose money when trading CFDs with this provider. You should consider whether you understand how CFDs work and whether you can afford to take the high risk of losing your money.
70.91% of retail investor accounts lose money when trading CFDs with this provider.
CFDs are complex instruments and come with a high risk of losing money rapidly due to leverage. 70.91% of retail investor accounts lose money when trading CFDs with this provider. You should consider whether you understand how CFDs work and whether you can afford to take the high risk of losing all your money. Read full risk warning.
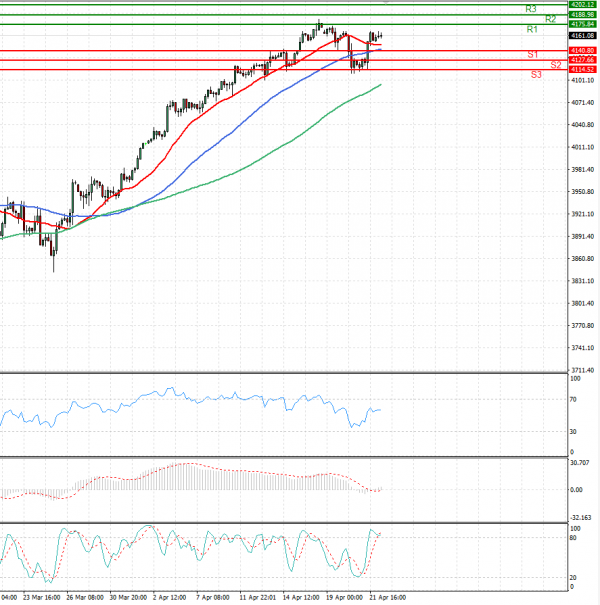
US Session Analysis for CFD Instruments 22/04/2021
Fundamental analysis
22 April, 2021
U.S. stock futures paused Thursday ahead of another batch of earnings and data that will give investors fresh insights into the economic recovery. Futures for the S&P 500 ticked down less than 0.1%. Contracts for the Dow Jones Industrial Average were flat. Futures on the technology-heavy Nasdaq-100 index were marginally higher. Stocks jumped higher on Wednesday, erasing most of their losses from earlier in the week. Many investors remain upbeat about the outlook for shares, but are growing concerned that a surge in coronavirus cases globally could delay plans to reopen economic activity. India on Thursday reported the world's biggest one-day rise in new infections. The earnings season continues today with American Airlines, Snap and Intel due to release their results.