Fortrade Canada Ltd. as an order-execution only dealer is not permitted to provide you with any advice or recommendations. These Market Commentaries should not be construed as a recommendation, advice or any attempt by Fortrade Canada Ltd. to prompt or influence you in making an investment decision to purchase, sell, hold or exchange any security or to influence the timing of such activity. This content is produced by Fortrade Limited which is not registered in any capacity with any securities regulatory authority in Canada.
69% of retail investor accounts lose money when trading CFDs with this provider.
CFDs are complex instruments and come with a high risk of losing money rapidly due to leverage. 69% of retail investor accounts lose money when trading CFDs with this provider. You should consider whether you understand how CFDs work and whether you can afford to take the high risk of losing your money.
70.88% of retail investor accounts lose money when trading CFDs with this provider.
CFDs are complex instruments and come with a high risk of losing money rapidly due to leverage. 70.88% of retail investor accounts lose money when trading CFDs with this provider. You should consider whether you understand how CFDs work and whether you can afford to take the high risk of losing all your money. Read full risk warning.
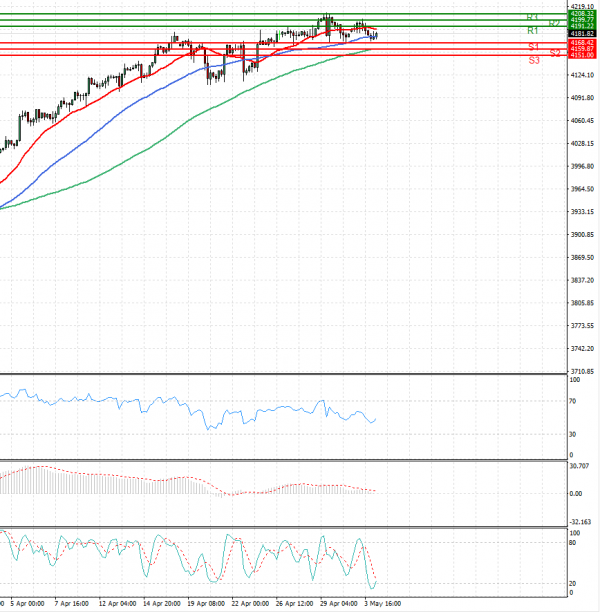
US Session Analysis for CFD Instruments 04/05/2021
Fundamental analysis
04 May, 2021
U.S. stock futures ticked down Tuesday as investors awaited data that will likely show the trade deficit widened to a fresh record in March. Futures tied to the broad S&P 500 index slid 0.2%. The benchmark advanced 0.3% on Monday, despite declines in giant technology stocks. Futures linked to the technology-heavy Nasdaq-100 fell 0.3% Tuesday. The major indexes are hovering close to record levels as investors weigh strong economic data and robust corporate earnings against inflation concerns and rising coronavirus cases in parts of the world. Some money managers say brightening prospects for the economy and for businesses’ profits has been baked into stocks’ valuations.