Fortrade Canada Ltd. as an order-execution only dealer is not permitted to provide you with any advice or recommendations. These Market Commentaries should not be construed as a recommendation, advice or any attempt by Fortrade Canada Ltd. to prompt or influence you in making an investment decision to purchase, sell, hold or exchange any security or to influence the timing of such activity. This content is produced by Fortrade Limited which is not registered in any capacity with any securities regulatory authority in Canada.
70% of retail investor accounts lose money when trading CFDs with this provider.
CFDs are complex instruments and come with a high risk of losing money rapidly due to leverage. 70% of retail investor accounts lose money when trading CFDs with this provider. You should consider whether you understand how CFDs work and whether you can afford to take the high risk of losing your money.
70.41% of retail investor accounts lose money when trading CFDs with this provider.
CFDs are complex instruments and come with a high risk of losing money rapidly due to leverage. 70.41% of retail investor accounts lose money when trading CFDs with this provider. You should consider whether you understand how CFDs work and whether you can afford to take the high risk of losing all your money. Read full risk warning.
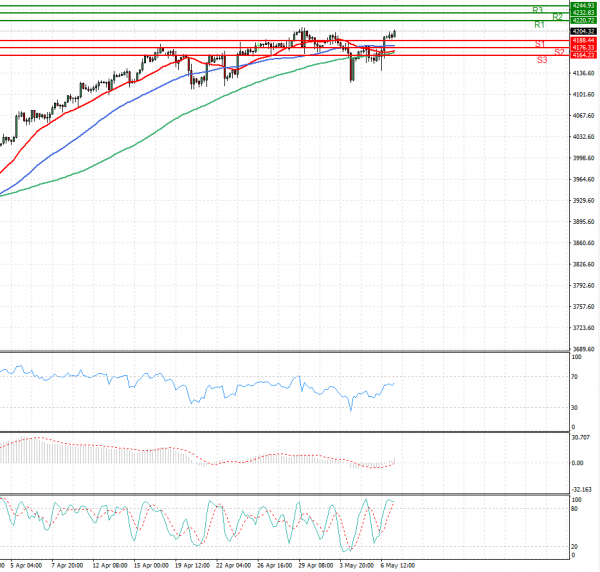
US Session Analysis for CFD Instruments 07/05/2021
Fundamental analysis
07 May, 2021
U.S. stock futures edged higher Friday ahead of fresh jobs data that is expected to show a strong recovery in the labor market following last year’s downturn. Futures tied to the S&P 500 ticked up 0.3%, a day after the broad-market index closed near its all-time high. Nasdaq-100 futures advanced 0.2%, pointing to muted gains in technology stocks. Futures linked to the Dow Jones Industrial Average rose 0.3%, suggesting that the blue-chips index may notch yet another closing record by the end of the week. Stocks are poised for a second week of muted gains, with sentiment bolstered by signs of a strengthening economy and Federal Reserve officials reiterated pledges to refrain from tightening monetary policy until the labor market is recovered. Energy producers, banks and other firms that would benefit from the economy reopening have rallied this week, while technology firms have been among the poorest performers.