Fortrade Canada Ltd. as an order-execution only dealer is not permitted to provide you with any advice or recommendations. These Market Commentaries should not be construed as a recommendation, advice or any attempt by Fortrade Canada Ltd. to prompt or influence you in making an investment decision to purchase, sell, hold or exchange any security or to influence the timing of such activity. This content is produced by Fortrade Limited which is not registered in any capacity with any securities regulatory authority in Canada.
70% of retail investor accounts lose money when trading CFDs with this provider.
CFDs are complex instruments and come with a high risk of losing money rapidly due to leverage. 70% of retail investor accounts lose money when trading CFDs with this provider. You should consider whether you understand how CFDs work and whether you can afford to take the high risk of losing your money.
70.41% of retail investor accounts lose money when trading CFDs with this provider.
CFDs are complex instruments and come with a high risk of losing money rapidly due to leverage. 70.41% of retail investor accounts lose money when trading CFDs with this provider. You should consider whether you understand how CFDs work and whether you can afford to take the high risk of losing all your money. Read full risk warning.
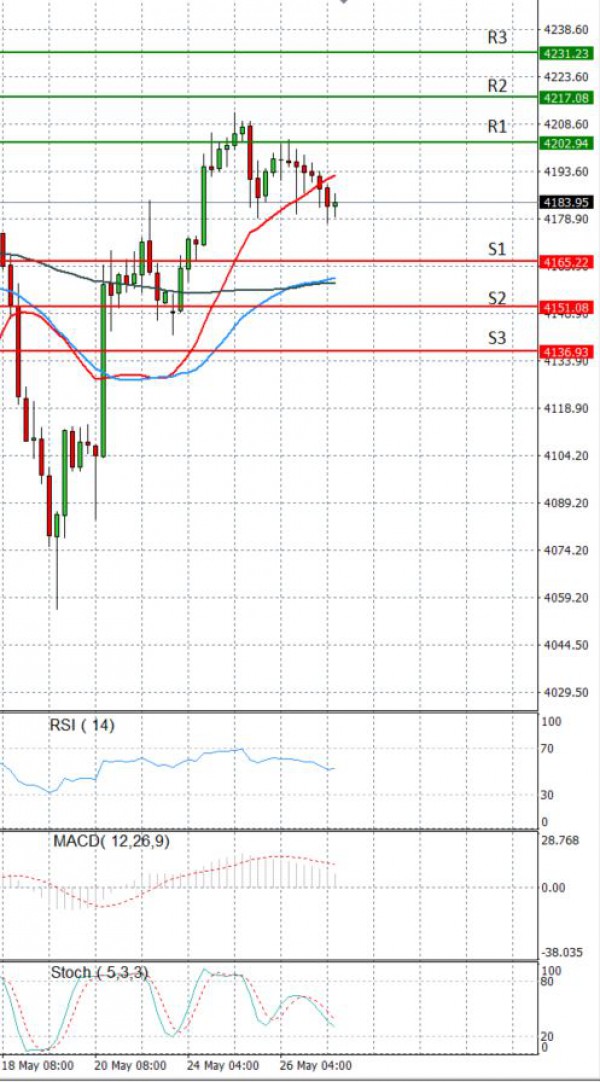
US Session Analysis for CFD Instruments 27/05/2021
Fundamental analysis
27 May, 2021
U.S. stock futures edged down ahead of a slew of economic data releases that are expected to spur discussion among investors about the Federal Reserve’s response to the strengthening economic recovery. Futures tied to the S&P 500 slipped 0.2%, suggesting a reversal of Wednesday’s tepid gains. Nasdaq-100 futures declined 0.4%, pointing to moderate losses for technology stocks after the opening bell. Investors will keep a close eye on so-called meme stocks popular with online traders. Shares in AMC Entertainment and GameStop were down around 3% in off-hours trading after Wednesday’s fresh bout of trading enthusiasm. Broader stock indexes have wavered this week as concerns about runaway inflation dwindled and Fed officials signaled that discussions about adjusting the pace of asset purchases may commence in the near future. Investors are closely monitoring indicators of economic activity to try to understand when monetary stimulus could begin to be scaled back.