Fortrade Canada Ltd. as an order-execution only dealer is not permitted to provide you with any advice or recommendations. These Market Commentaries should not be construed as a recommendation, advice or any attempt by Fortrade Canada Ltd. to prompt or influence you in making an investment decision to purchase, sell, hold or exchange any security or to influence the timing of such activity. This content is produced by Fortrade Limited which is not registered in any capacity with any securities regulatory authority in Canada.
71% of retail investor accounts lose money when trading CFDs with this provider.
CFDs are complex instruments and come with a high risk of losing money rapidly due to leverage. 71% of retail investor accounts lose money when trading CFDs with this provider. You should consider whether you understand how CFDs work and whether you can afford to take the high risk of losing your money.
70.41% of retail investor accounts lose money when trading CFDs with this provider.
CFDs are complex instruments and come with a high risk of losing money rapidly due to leverage. 70.41% of retail investor accounts lose money when trading CFDs with this provider. You should consider whether you understand how CFDs work and whether you can afford to take the high risk of losing all your money. Read full risk warning.
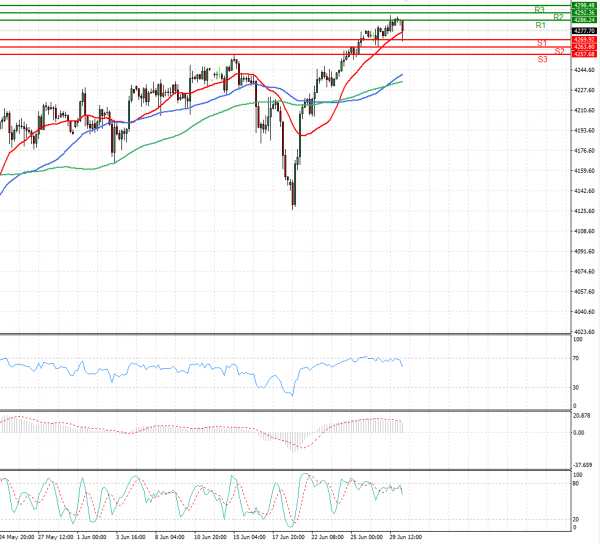
US Session Analysis for CFD Instruments 30/06/2021
Fundamental analysis
30 June, 2021
U.S. stock futures ticked lower Wednesday, suggesting that the major indexes will hover just shy of record highs following a June rally powered by technology stocks. Futures tied to the S&P 500 edged down 0.1% after the broad-market index closed at its 33rd all-time high of 2021. The gauge has climbed 2.1% so far in June in its fifth consecutive month of gains. Contracts linked to the Dow Jones Industrial Average suggest that the blue-chips index will end June lower, marking its weakest month since January. Nasdaq-100 futures were relatively flat, pointing to tepid moves in technology stocks a day after the index notched a record high. The benchmark for large-cap technology stocks has climbed 6.5% so far in June, putting it on track to close out its best month since it rose 11% in November.