Fortrade Canada Ltd. as an order-execution only dealer is not permitted to provide you with any advice or recommendations. These Market Commentaries should not be construed as a recommendation, advice or any attempt by Fortrade Canada Ltd. to prompt or influence you in making an investment decision to purchase, sell, hold or exchange any security or to influence the timing of such activity. This content is produced by Fortrade Limited which is not registered in any capacity with any securities regulatory authority in Canada.
69% of retail investor accounts lose money when trading CFDs with this provider.
CFDs are complex instruments and come with a high risk of losing money rapidly due to leverage. 69% of retail investor accounts lose money when trading CFDs with this provider. You should consider whether you understand how CFDs work and whether you can afford to take the high risk of losing your money.
70.88% of retail investor accounts lose money when trading CFDs with this provider.
CFDs are complex instruments and come with a high risk of losing money rapidly due to leverage. 70.88% of retail investor accounts lose money when trading CFDs with this provider. You should consider whether you understand how CFDs work and whether you can afford to take the high risk of losing all your money. Read full risk warning.
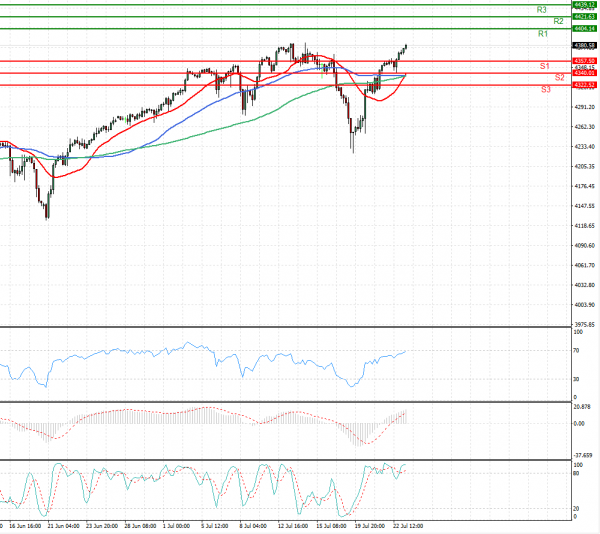
US Session Analysis for CFD Instruments 23/07/2021
Fundamental analysis
23 July, 2021
U.S. stock futures rose Friday, putting major indexes on track for weekly gains with large technology stocks driving the rally. Futures for the S&P 500 edged up 0.4%, pointing to the index extending gains. The broad market gauge had advanced over 0.9% for the week by Thursday’s close, despite the steep leg down on Monday. Contracts for the Dow Jones Industrial Average ticked 0.3% higher. Futures on the technology-focused Nasdaq-100 added 0.5%. The monthslong rally in stocks has resumed after markets skidded at the start of the week in response to concerns about the fast-spreading Delta variant. Investors have drawn comfort from rapid earnings growth at the biggest American companies. Money managers also say governments in the U.S. and Europe are unlikely to bring in lockdowns that restrict growth, even if rising cases take the shine off the economic recovery.