Fortrade Canada Ltd. as an order-execution only dealer is not permitted to provide you with any advice or recommendations. These Market Commentaries should not be construed as a recommendation, advice or any attempt by Fortrade Canada Ltd. to prompt or influence you in making an investment decision to purchase, sell, hold or exchange any security or to influence the timing of such activity. This content is produced by Fortrade Limited which is not registered in any capacity with any securities regulatory authority in Canada.
71% of retail investor accounts lose money when trading CFDs with this provider.
CFDs are complex instruments and come with a high risk of losing money rapidly due to leverage. 71% of retail investor accounts lose money when trading CFDs with this provider. You should consider whether you understand how CFDs work and whether you can afford to take the high risk of losing your money.
70.91% of retail investor accounts lose money when trading CFDs with this provider.
CFDs are complex instruments and come with a high risk of losing money rapidly due to leverage. 70.91% of retail investor accounts lose money when trading CFDs with this provider. You should consider whether you understand how CFDs work and whether you can afford to take the high risk of losing all your money. Read full risk warning.
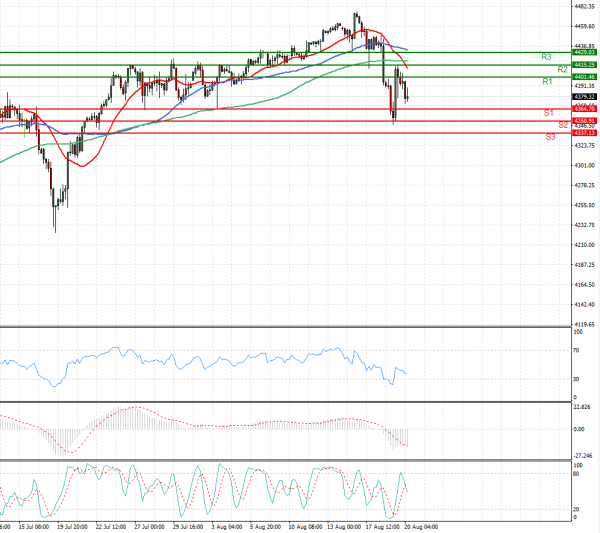
US Session Analysis for CFD Instruments 20/08/2021
Fundamental analysis
20 August, 2021
U.S. stock futures slid Friday, putting the S&P 500 and the Dow Jones Industrials Average on course to erase most or all of August’s gains. Futures tied to the S&P 500 retreated 0.5%, indicating that the broader market may post losses at the opening bell. The index has shed almost 1.4% this week through Thursday’s close, leaving it on track for its biggest weekly loss since mid-June. Futures tied to the Dow Jones Industrial Average futures contracted 0.6%. The blue-chip index has dropped 1.8% so far this week. Contracts tied to the technology-heavy Nasdaq-100 ticked down 0.3%. Stocks have been rocked this week by concerns that an uptick in Covid-19 infections globally and a slowdown in China’s growth could impede the economic recovery. Worries about rising inflation levels and the Federal Reserve’s signals that it will scale back some of its easy money policies are also weighing on sentiment. New lockdowns to contain the virus could put further pressure on supply chains, investors say.