Fortrade Canada Ltd. as an order-execution only dealer is not permitted to provide you with any advice or recommendations. These Market Commentaries should not be construed as a recommendation, advice or any attempt by Fortrade Canada Ltd. to prompt or influence you in making an investment decision to purchase, sell, hold or exchange any security or to influence the timing of such activity. This content is produced by Fortrade Limited which is not registered in any capacity with any securities regulatory authority in Canada.
71% of retail investor accounts lose money when trading CFDs with this provider.
CFDs are complex instruments and come with a high risk of losing money rapidly due to leverage. 71% of retail investor accounts lose money when trading CFDs with this provider. You should consider whether you understand how CFDs work and whether you can afford to take the high risk of losing your money.
70.41% of retail investor accounts lose money when trading CFDs with this provider.
CFDs are complex instruments and come with a high risk of losing money rapidly due to leverage. 70.41% of retail investor accounts lose money when trading CFDs with this provider. You should consider whether you understand how CFDs work and whether you can afford to take the high risk of losing all your money. Read full risk warning.
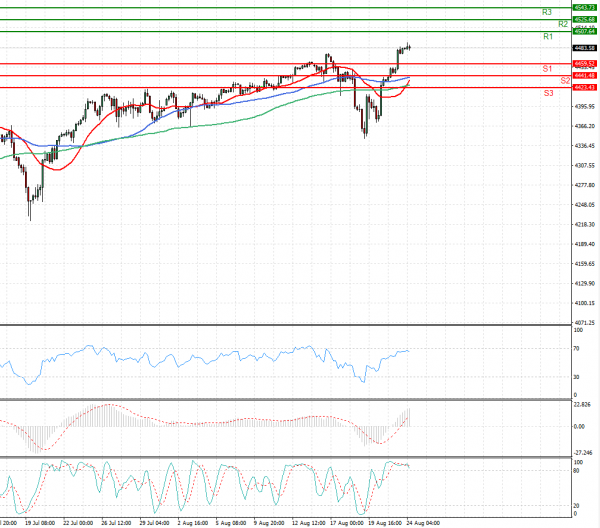
US Session Analysis for CFD Instruments 24/08/2021
Fundamental analysis
24 August, 2021
U.S. stock futures edged up Tuesday, suggesting that gains in technology stocks will help send the S&P 500 to an all-time high, as investors awaited housing market data. Futures tied to the S&P 500 ticked 0.3% higher. A day earlier, the broad market index closed at its second-highest level ever. Dow Jones Industrial Average futures gained 0.2% on Tuesday, while technology-heavy Nasdaq-100 futures rose 0.5%. Stocks have been grinding higher as investors weigh strong corporate earnings and the economic rebound against the global surge in Covid-19 cases, which is prompting fresh restrictions in some markets. Money managers are also assessing whether the Federal Reserve may slow down plans to pare back its easy-money policies because of signs that economic growth may be slowing.