Fortrade Canada Ltd. as an order-execution only dealer is not permitted to provide you with any advice or recommendations. These Market Commentaries should not be construed as a recommendation, advice or any attempt by Fortrade Canada Ltd. to prompt or influence you in making an investment decision to purchase, sell, hold or exchange any security or to influence the timing of such activity. This content is produced by Fortrade Limited which is not registered in any capacity with any securities regulatory authority in Canada.
71% of retail investor accounts lose money when trading CFDs with this provider.
CFDs are complex instruments and come with a high risk of losing money rapidly due to leverage. 71% of retail investor accounts lose money when trading CFDs with this provider. You should consider whether you understand how CFDs work and whether you can afford to take the high risk of losing your money.
70.41% of retail investor accounts lose money when trading CFDs with this provider.
CFDs are complex instruments and come with a high risk of losing money rapidly due to leverage. 70.41% of retail investor accounts lose money when trading CFDs with this provider. You should consider whether you understand how CFDs work and whether you can afford to take the high risk of losing all your money. Read full risk warning.
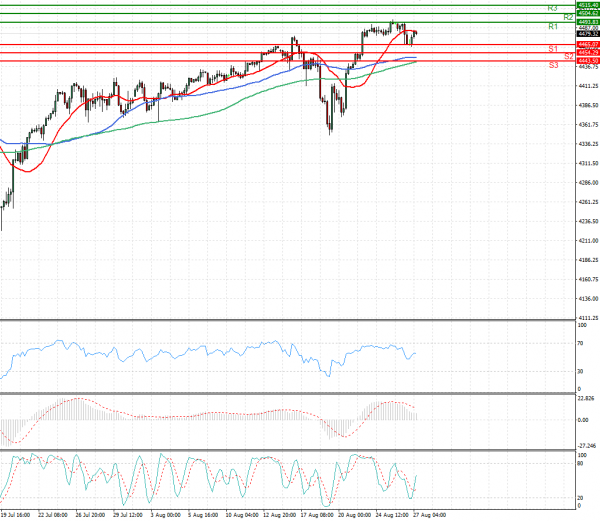
US Session Analysis for CFD Instruments 27/08/2021
Fundamental analysis
27 August, 2021
Stock futures rose Friday as investors awaited Federal Reserve Chairman Jerome Powell’s speech at Jackson Hole, seeking clues about when the central bank might start to scale back its easy-money policies. Futures for the S&P 500 edged up 0.3%. The benchmark index retreated 0.6% on Thursday, erasing some of the gains made this week. Contracts for the Dow Jones Industrial Average and technology-heavy Nasdaq-100 also ticked up 0.3% Friday. Major indexes are close to all-time highs, powered by expectations that strong economic growth will extend a surge in corporate profits. A key question for investors is when the Fed will scale back its $120 billion in monthly asset purchases and consider raising interest rates. Minutes from the Fed’s late July policy gathering showed that many of the officials thought asset buying could start to slow down by the end of this year.