Fortrade Canada Ltd. as an order-execution only dealer is not permitted to provide you with any advice or recommendations. These Market Commentaries should not be construed as a recommendation, advice or any attempt by Fortrade Canada Ltd. to prompt or influence you in making an investment decision to purchase, sell, hold or exchange any security or to influence the timing of such activity. This content is produced by Fortrade Limited which is not registered in any capacity with any securities regulatory authority in Canada.
69% of retail investor accounts lose money when trading CFDs with this provider.
CFDs are complex instruments and come with a high risk of losing money rapidly due to leverage. 69% of retail investor accounts lose money when trading CFDs with this provider. You should consider whether you understand how CFDs work and whether you can afford to take the high risk of losing your money.
67.52% of retail investor accounts lose money when trading CFDs with this provider.
CFDs are complex instruments and come with a high risk of losing money rapidly due to leverage. 67.52% of retail investor accounts lose money when trading CFDs with this provider. You should consider whether you understand how CFDs work and whether you can afford to take the high risk of losing all your money. Read full risk warning.
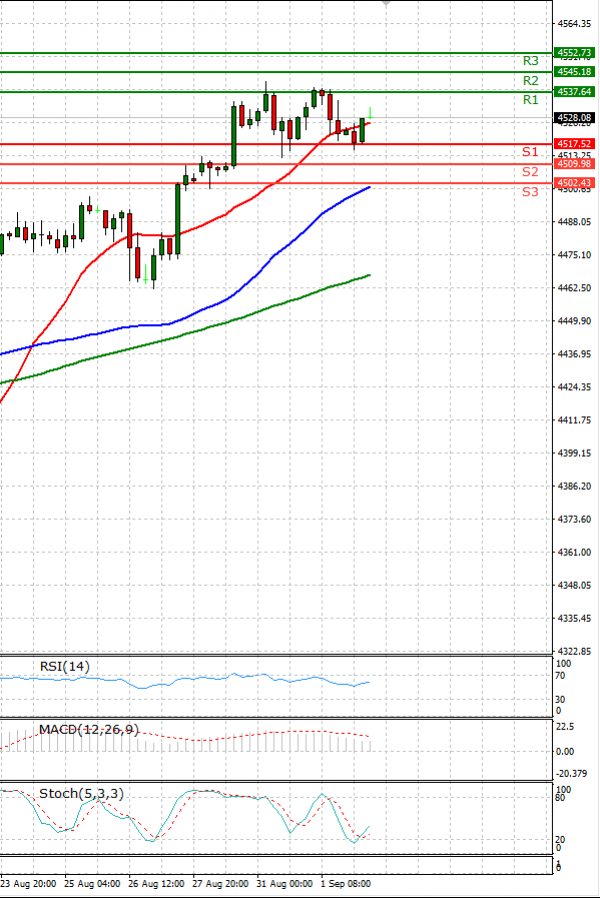
US Session Analysis for CFD Instruments 02/09/2021
Fundamental analysis
02 September, 2021
The USA500 was trading moderately higher ahead of the American market opening on Thursday. It is presently 4,528.08. Investors and traders remain cautiously optimistic that the U.S. Federal Reserve will continue its loose monetary policy which has been very good for the equity markets. All eyes will be on today’s initial jobless claims in the United States and tomorrow’s monthly employment data, because Chairman Powell of the U.S. Federal Reserve has made it clear that the health of the American labor market will dictate when they begin to taper their asset purchases. The U.S. central bank currently buys $120 billion per month of treasuries and mortgage backed securities.